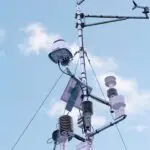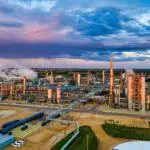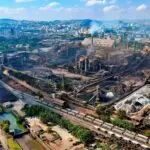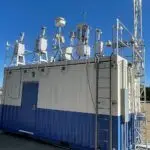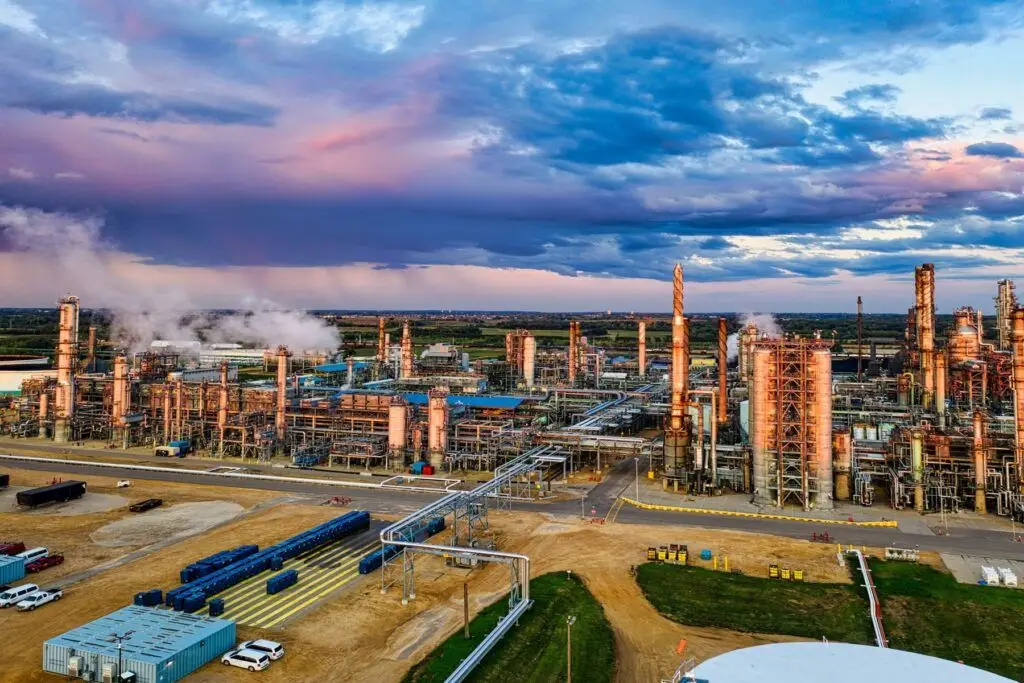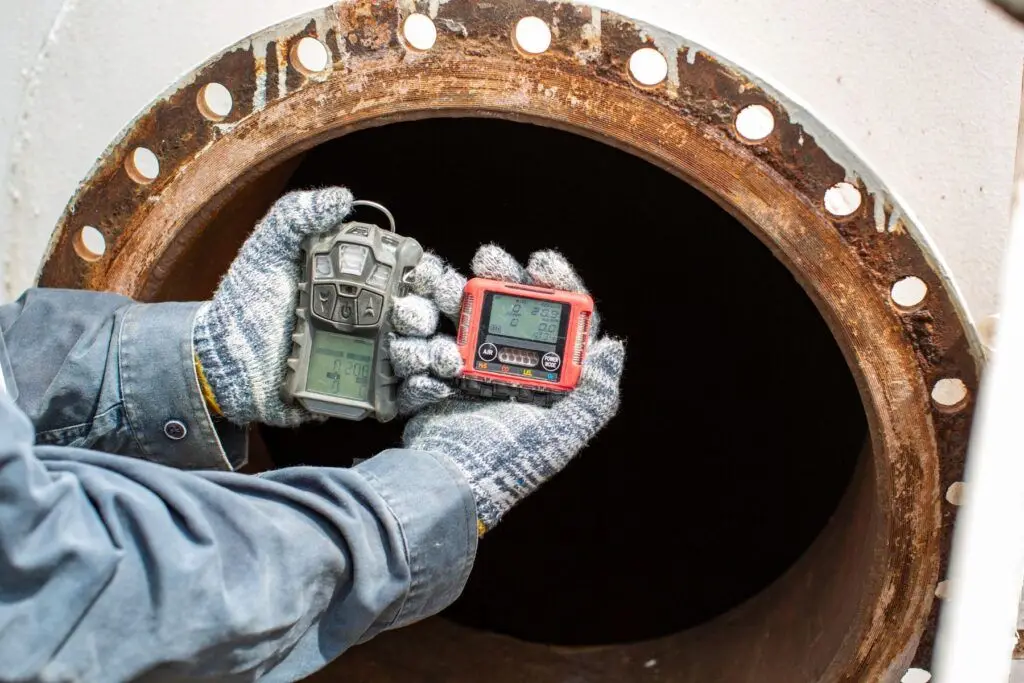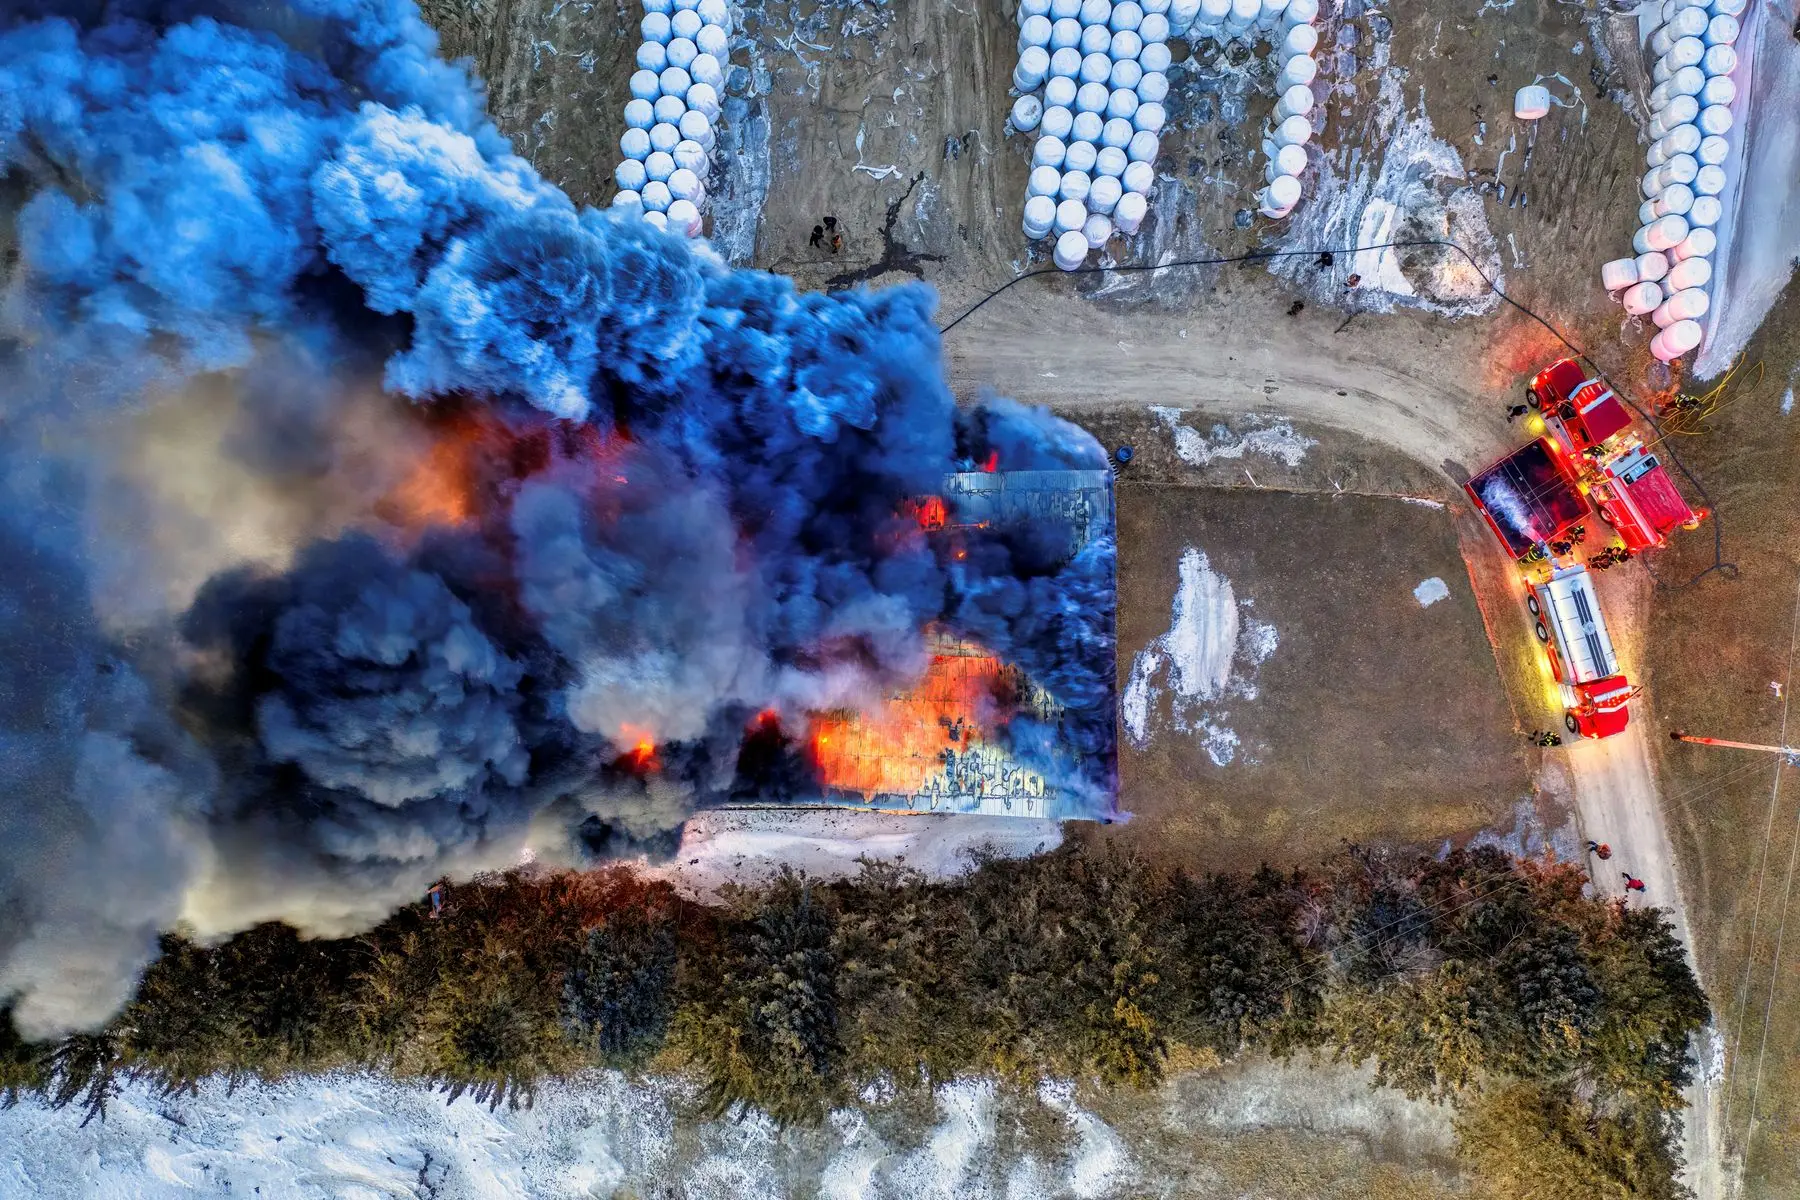

Environmental emergency response is the rapid assessment and control of the environmental risks arising from accidents such as industrial incidents, fires, spills or accidental releases of chemical substances. When an incident affects the air, continuous monitoring makes it possible to measure gases, volatile organic compounds and particulate matter in real time, while meteorological data helps determine the direction of the pollution plume and the areas that may be affected. Sensor networks complement conventional sampling and periodic inspections with threshold alerts and incident tracking, so that decisions are based on observed data.
Until recently, much of industrial environmental control has relied on periodic campaigns, inspections and measurements. Although these are necessary and must be maintained, they have an obvious limitation: an environmental emergency can start between two inspections. Continuous monitoring narrows that time gap. The aim is not to present sensors as an alternative to traditional systems, but as an additional layer of surveillance that completes periodic inspections, safety systems, confirmatory sampling and modelling.
This article explains what an environmental emergency is and how the response to these incidents is structured, which types of incident call for dedicated air monitoring and how continuous surveillance closes the time gaps between periodic inspections. It also covers the key parameters to measure, how real-time monitoring works step by step during an emergency, the role of threshold alerts and how data speeds up decision-making. It then reviews some real examples of adoption by environmental agencies and practical cases, together with the keys to designing a preparedness plan, the importance of data quality and what a sensor network can and cannot do. Finally, it analyses how a sensor network fits into this strategy before, during and after an environmental emergency, until the situation returns to normal.
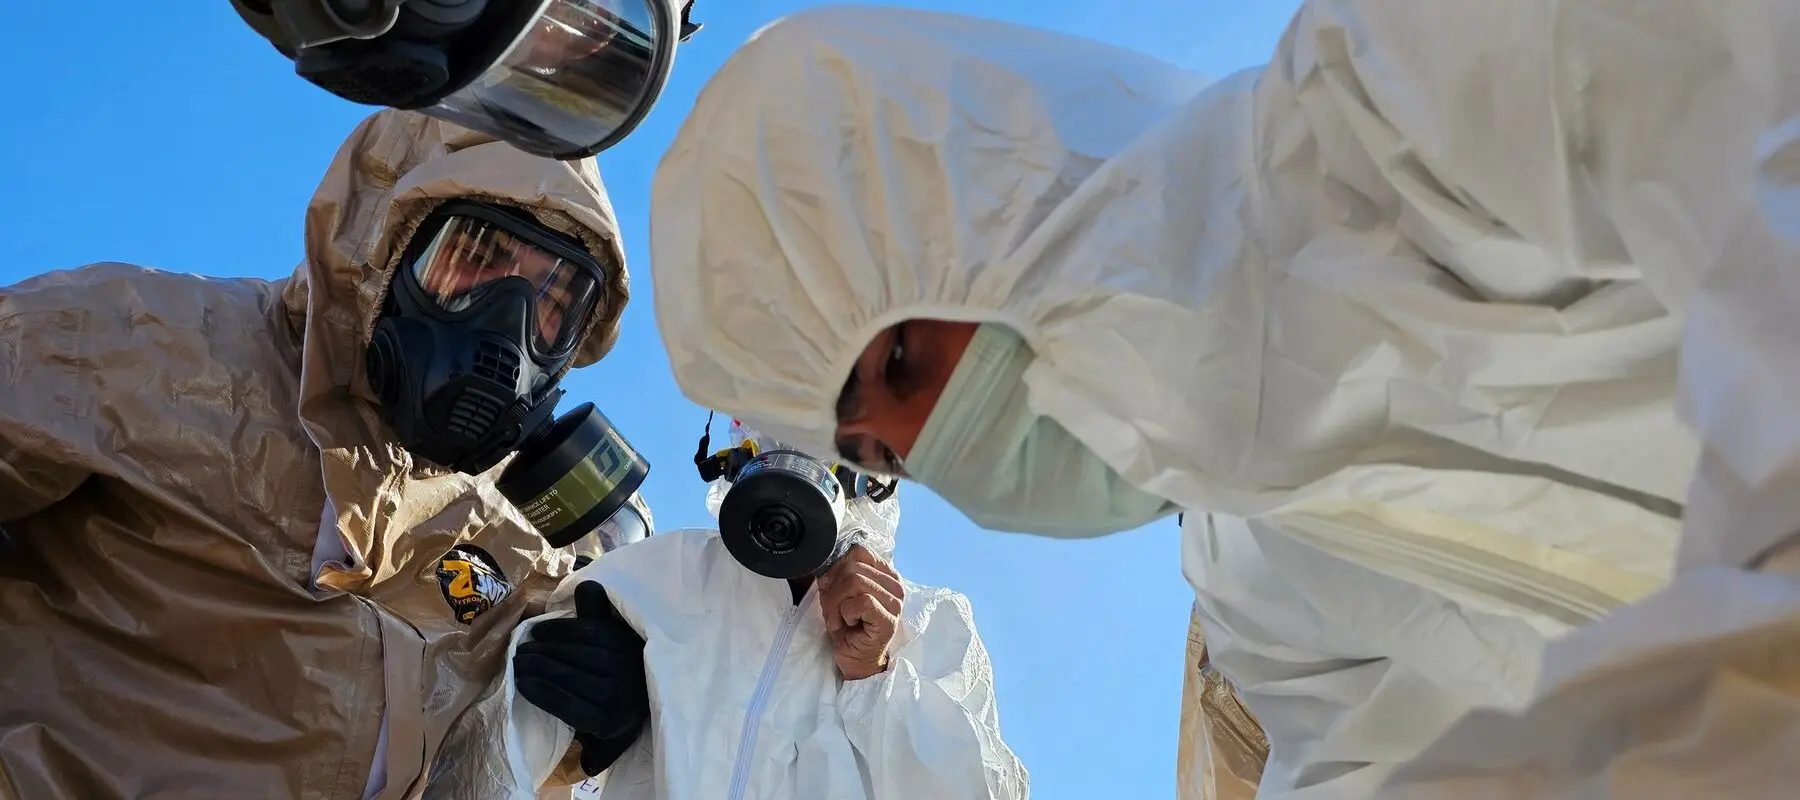
Not every environmental anomaly is necessarily an emergency: a one-off peak in particulate matter, for example, may have an operational explanation and pose no real risk.
What is an environmental emergency
An environmental emergency is a sudden or uncontrolled situation that can cause significant, irreversible damage to the environment, to human health or to both. It usually originates from an industrial accident, a fire, an explosion, a leak of hazardous substances, a chemical spill or another event capable of releasing pollutants into the air, water or soil.
Air Quality Innovation in Just 1 Click
Stay informed about the air you breathe!
Subscribe to our newsletter to receive the latest updates on environmental monitoring technology, air quality studies, and more.
Not every environmental anomaly is necessarily an emergency: a one-off peak in particulate matter, for example, may have an operational explanation and pose no real risk. On the other hand, the severity of any incident affecting the environment has to be taken into account. It depends on several factors, such as the type of substance released, the quantity emitted, the duration of the incident, atmospheric dispersion conditions and environmental exposure, whether of workers, the public or sensitive ecosystems.
Some emergencies have an especially dynamic atmospheric component, because pollutants can travel quickly with the wind beyond the point of emission. A localised problem thus becomes a risk affecting areas that, minutes earlier, did not seem to be compromised.
Main types of environmental emergency
Although each environmental emergency has its own characteristics, they can be broadly classified by origin and nature:
- Industrial accidents: process failures, equipment breakdowns or operating errors that cause uncontrolled releases.
- Fires and explosions: they produce complex smoke containing particles, gases and volatile organic compounds.
- Toxic gas leaks: releases of hazardous gaseous substances such as H2S, NH3, SO2, Cl2 or CO, among others.
- Chemical or petrochemical spillsPetrochemical spills are accidental or uncontrolled releases of oil, fuels, feedstocks or petroleum-derived chemicals from tanks, pipelines, process equipm...
Read more: some liquid products can volatilise and generate secondary atmospheric plumes. - Accidental emissionsAtmospheric emissions are pollutants released into the air from both human activities and natural sources. The main anthropogenic sources include industry,...
Read more: unplanned releases during loading, unloading or maintenance operations. - Severe air pollution episodes: accumulations or meteorological events that suddenly concentrate pollutants.

Some environmental emergencies have an especially dynamic atmospheric component, because pollutants can travel quickly with the wind beyond the point of emission.
What is an environmental emergency response
Environmental emergency response brings together the actions aimed at identifying risks quickly, assessing the extent of the contamination, protecting workers and the public, limiting the spread of the incident and then checking that environmental conditions have returned to acceptable levels.
Depending on the type of environmental incident, this process may include several interconnected stages:
| Response stage | Description |
|---|---|
| Initial incident assessment | Determine what has happened, which substances may be involved and the likely extent. |
| Substance identification | Establish which compounds have been released in order to assess their toxicity and behaviour. |
| Monitoring and sampling | Measure concentrations in real time and collect samples for confirmatory analysis. |
| Dispersion modelling | Project the movement of the pollutant plume as meteorological conditions change. |
| Affected areas | Delimit risk areas so that protective measures can be applied. |
| Control measures | Actions to contain the source, reduce emissions and mitigate impacts. |
| Communication | Clear information for authorities, workers and the affected population. |
| Follow-up and recovery | Verify that conditions return to normal and document the incident. |
Key response technologies for sudden atmospheric accidents include, among others, emergency monitoring, source estimation and pollutant dispersion simulation. Duan et al. (2023).
The role of environmental monitoring during an emergency
In the first minutes of an incident, information is scarce. It is not known which pollutant has been released, since when it has been happening or in what quantity. When there is an atmospheric component, having real-time data reduces that initial uncertainty and shows which pollutants are present, how their concentrations are changing and where they may move.
That is why continuous monitoring does not work alone. It operates as one piece of a wider strategy that combines periodic inspections, safety systems, confirmatory sampling and modelling. Each element covers a different need, and the sensor network provides what is usually missing in the first hours: a permanent reading of what is happening in the air.
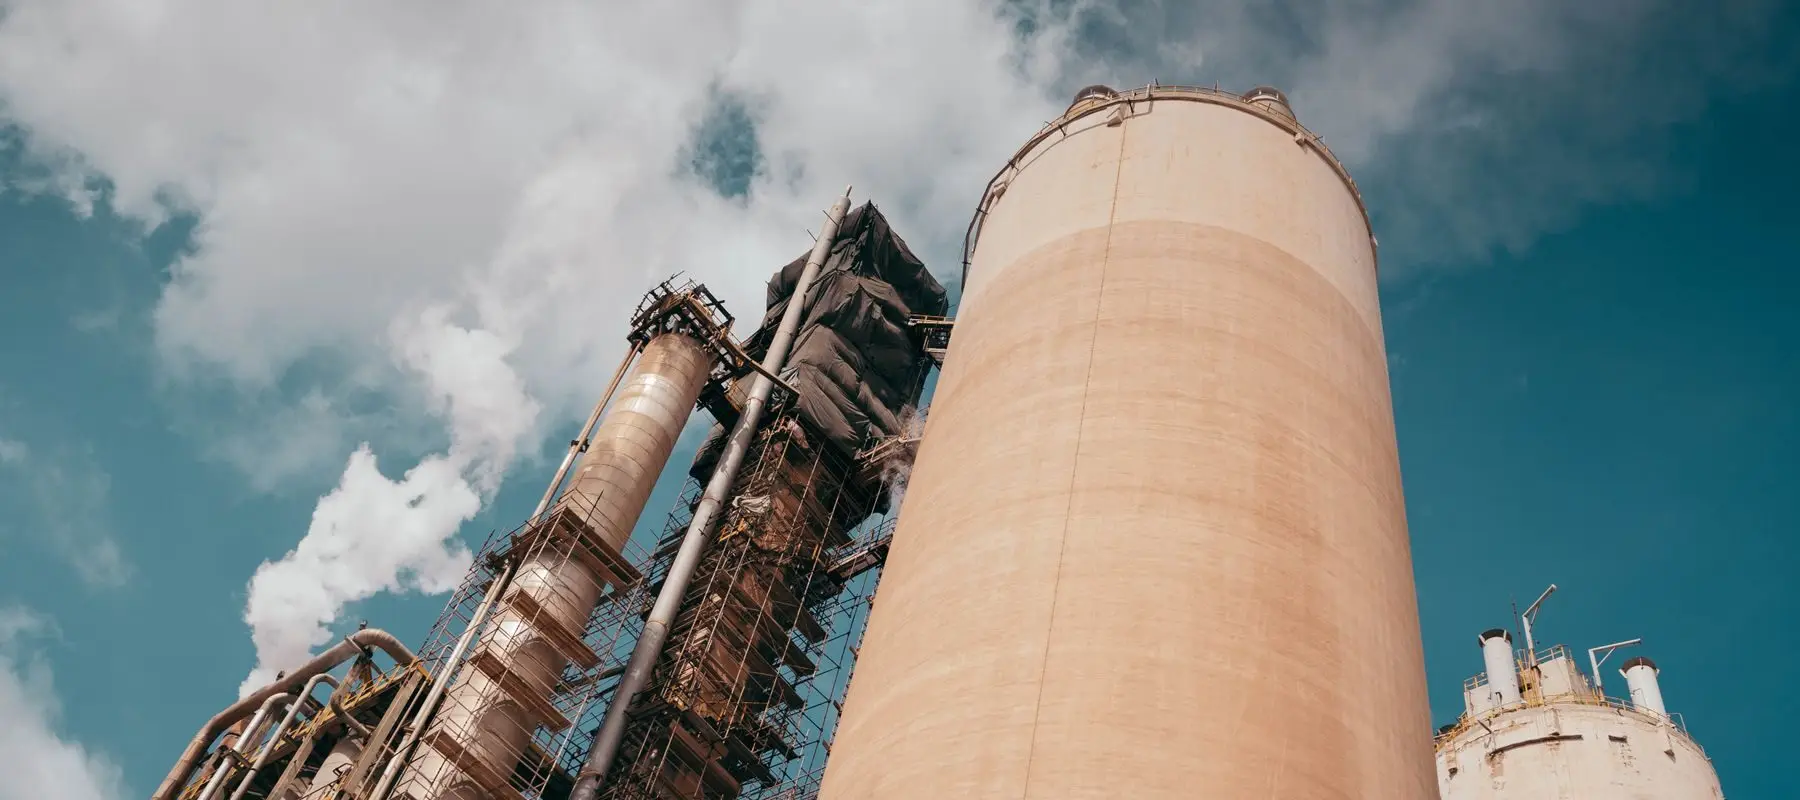
A sensor network fits into the environmental emergency response strategy before, during and after an incident, until the situation returns to normal.
Which types of environmental emergency require air monitoring
Not all environmental incidents have an atmospheric component, but in those that do, time is critical. Pollutants disperse, dilute and change direction with the wind, so a late measurement can describe a situation that no longer exists.
The types of incident where this surveillance is especially critical are:
Industrial fires and explosions
Industrial fires can generate a complex mixture of pollutants depending on the materials and processes involved. Among the most relevant parameters to consider are:
- PM2.5 and PM10: fine and coarse particles that can penetrate the respiratory system.
- CO (carbon monoxide): a toxic gas produced by incomplete combustion.
- NOx (nitrogen oxides): formed at high temperatures.
- SO2 (sulphur dioxide): released when materials containing sulphur are burned.
- VOCs (volatile organic compounds): hydrocarbons and other volatilised organic compounds.
- Specific gases: depending on the materials stored or processed.
Accidental releases of toxic gases
Toxic gas leaks are one of the most critical scenarios, because it is essential to know which substance has been released and at what concentration it reaches work areas or inhabited areas.
The most common gases include:
- H2S (hydrogen sulphide): common in petrochemical and water treatment industries.
- NH3 (ammonia): used in industrial refrigeration and fertilisers.
- SO2 (sulphur dioxide): present in combustion processes and sulphuric acid plants.
- Cl2 (chlorine): used in water treatment and chemical processes.
- HCl (hydrogen chloride): can form in fires involving plastic materials.
- HF (hydrogen fluoride): present in some chemical and aluminium industries.
- CO (carbon monoxide): produced by incomplete combustion.
To these gases is added CH4 (methane), which is not toxic but is flammable, and whose early detection is key to preventing explosions.
Continuous toxic gas monitoring in these situations makes it possible to quickly assess the concentration and dispersion of the pollution plume.
Chemical and petrochemical spills
Although spills are mainly associated with soil and water contamination, certain liquid products can volatilise and generate a secondary atmospheric plume that represents an additional risk. This volatilisation depends on the vapour pressure of the product, the ambient temperature, wind speed and the exposed surface.
Chemical leak monitoring in these scenarios should focus on the presence of VOCs, TVOCs (total volatile organic compounds) and specific compounds according to the type of product spilled, making it possible to assess both volatilisation and the reach of the atmospheric plume generated.
Fugitive emissions and process failures
Not every anomaly detected in an environmental incident starts with a visible accident. A valve, tank, pipe or connection can begin to emit before there is any obvious incident. These fugitive emissions are an area where continuous monitoring provides especially important preventive value.
The parameters to watch depend on the type of facility. The most common include:
- VOCs and TVOCs: emitted in refineries, chemical plants and hydrocarbon storage.
- Benzene: the reference VOC in refinery fenceline control because it is carcinogenic.
- CH4 (methane): associated with oil and gas facilities, landfills and biogas plants.
- H2S (hydrogen sulphide): frequent in refining, wastewater treatment plants and waste treatment.
- NH3 (ammonia): present in fertiliser plants and industrial refrigeration systems.
In the US, the EPA requires refineries to measure benzene at the fenceline and, if the difference between monitoring points exceeds 9 µg/m3 as an annual average, to investigate the cause and apply corrective measures.
Leak detection and repair (LDAR) programmes locate these losses during inspection campaigns, and fenceline monitoring adds a permanent reading at the boundary of the facility. Continuous fugitive emissions monitoring makes it possible to detect increases in concentration between campaigns and to act before a minor loss turns into an incident.
| Type of incident | Main risk | Key parameters | What monitoring provides |
|---|---|---|---|
| Industrial fires and explosions | Release of a complex mixture of pollutants that varies with the materials and processes involved | PM2.5, PM10, CO, NOx, SO2, VOCs and specific gases depending on what is stored or processed | Characterise what is being emitted and at what concentration |
| Accidental releases of toxic gases | Gas reaching work areas or inhabited areas | H2S, NH3, SO2, Cl2, HCl, HF, CO; plus CH4 because of its flammability risk | Identify the substance and quickly assess its concentration and the dispersion of the plume |
| Chemical and petrochemical spills | Secondary atmospheric plume caused by volatilisation of the product (depends on vapour pressure, temperature, wind and exposed surface) | VOCs, TVOCs and compounds specific to the spilled product | Assess volatilisation and the reach of the plume |
| Fugitive emissions and process failures | Emissions from valves, tanks, pipes or connections before there is a visible incident | VOCs, TVOCs, benzene, CH4, H2S, NH3, depending on the type of facility | Detect increases in concentration between LDAR campaigns and maintain a permanent reading at the perimeter (in US refineries, fenceline benzene monitoring is mandatory) |
An environmental emergency can start between two periodic inspections.
From periodic inspections to continuous environmental surveillance
The point is not to choose between inspecting and monitoring, but to understand what each tool provides and what gap the other one covers.
Why periodic inspections are still necessary
Periodic inspections, LDAR programmes, laboratory sampling and safety systems do not disappear in an environmental emergency response. On the contrary, they offer a diagnostic capability that no sensor matches, they identify specific compounds and they make it possible to verify the real condition of equipment. What they cannot do is observe what happens when the inspector is not present or the campaign has ended. That is where continuous monitoring plays its essential role, by covering that interval continuously and without competing with those other environmental surveillance measures.
What continuous monitoring provides
The difference is easier to see by comparing how each approach works:
| Periodic inspection | Continuous monitoring |
|---|---|
| Snapshot in time | Continuous evolution |
| Detects what happens during the visit | Can detect incidents between inspections |
| High diagnostic capability | High temporal resolution |
| Requires presence or a campaign | Can operate permanently |
| Used to verify | Used to alert and follow |
A permanent environmental monitoring network records the usual baseline level at each point, and with that reference normal variations can be distinguished from real deviations. It can thus identify when an incident starts, how long it lasts, what maximum concentration it reaches, how it evolves, in which direction it spreads and when normal conditions are restored.
Early alerts before the incident gets worse
A sensor network does not predict an emergency. What it does is detect a deviation while it is still small. An automatic alert can shorten the time between the appearance of an environmental anomaly and the decision to investigate or act. If an H2S concentration rises at a perimeter point at three in the morning, the warning reaches whoever needs to check it within minutes, not on the next inspection round.
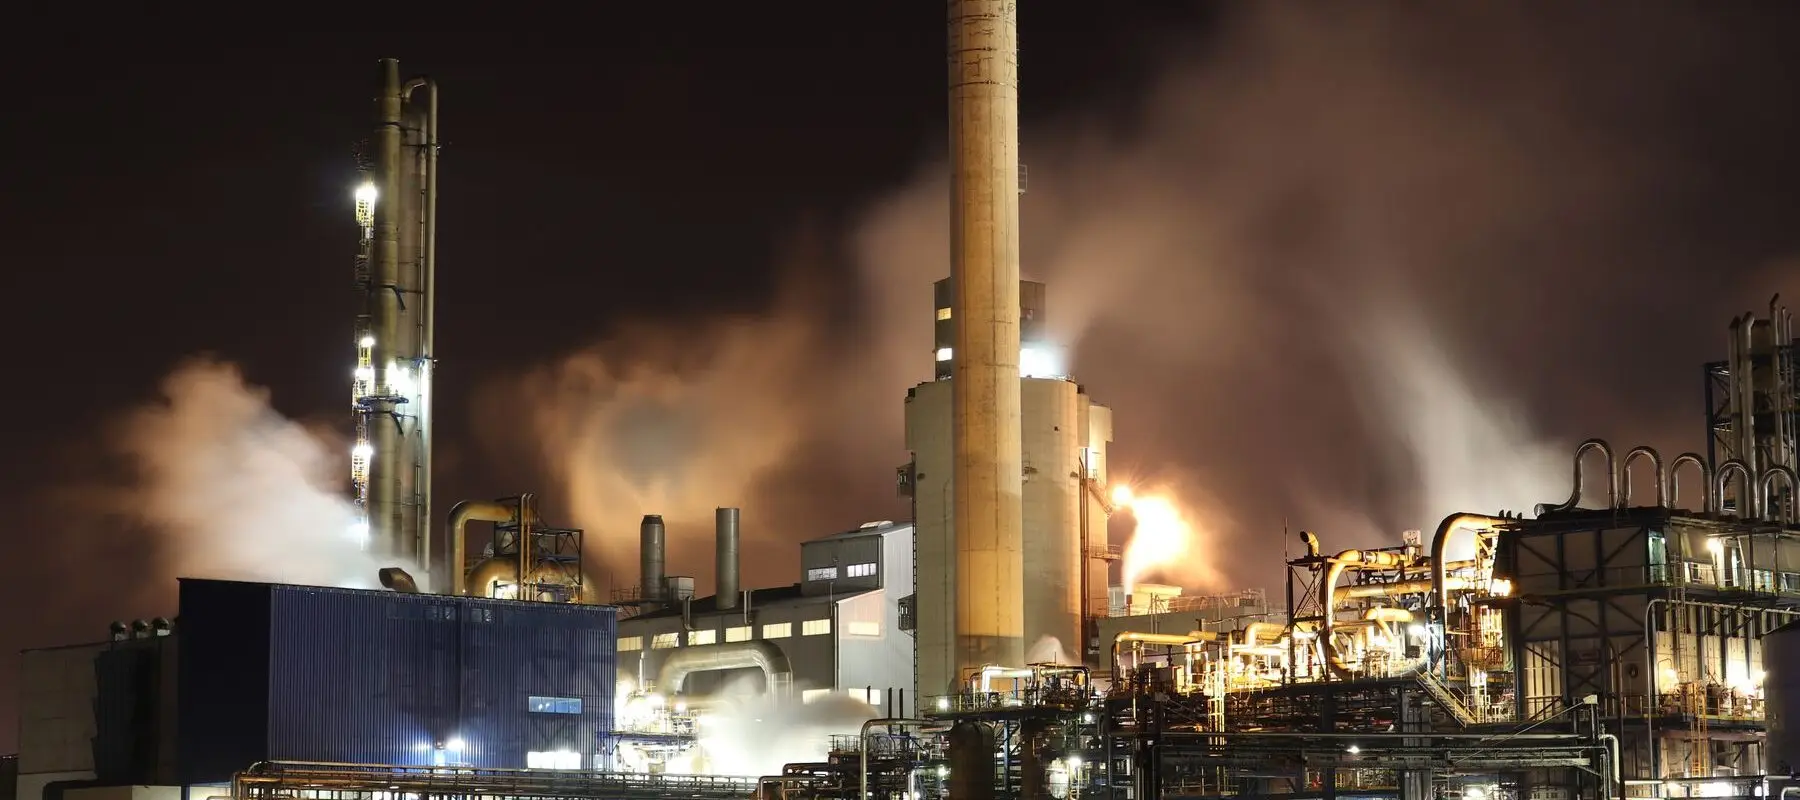
Sensor networks are an additional layer of surveillance for environmental emergencies that completes periodic inspections, safety systems, confirmatory sampling and modelling.
Which parameters should be monitored during an environmental emergency
There is no sensor configuration that is valid for monitoring every industrial accident. The pollutants worth measuring depend on the substances stored, the facility’s processes and the products that may form through combustion or decomposition. That is why the selection of pollutants to monitor must start from the facility’s chemical inventory and not from a generic incident response configuration.
Type of incident, pollutants and objective
| Type of incident | Most relevant parameters | What information they provide |
|---|---|---|
| Industrial fire | PM2.5, PM10, CO, NO2, SO2, VOCs | Intensity, evolution and reach |
| Gas leak | H2S, NH3, SO2, Cl2, HCl, HF, CH4 | Concentration and dispersion |
| Chemical spill | VOCs, TVOCs and specific compounds | Volatilisation and reach |
| Fugitive emission | CH4, H2S, VOCs, NH3 | Incidents and anomalies |
| Dust | PM10, PM2.5, TSP | Intensity and dispersion |
| Any incident | Wind, temperature, humidity, pressure | Transport and interpretation |
Without considering meteorological variables such as wind direction and speed, a high concentration of pollutants in the air does indicate that something is happening. But it does not show where it comes from or where the atmospheric plume is heading. Temperature, humidity and air pressure also help interpret dispersion and correct possible measurement interferences.
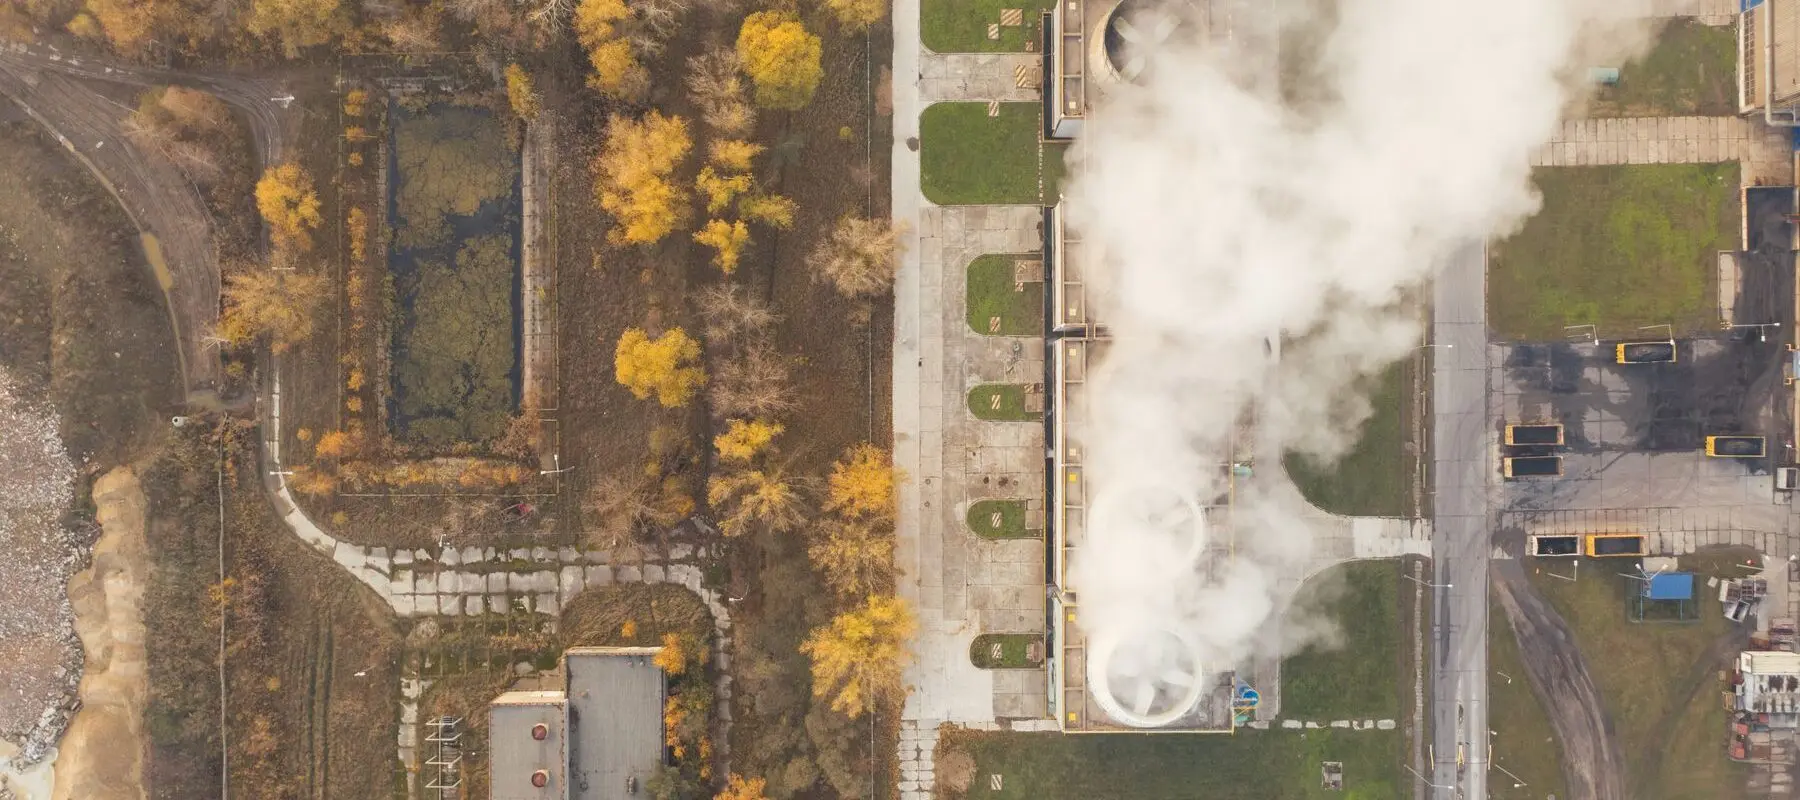
When the incident causing an environmental emergency affects the air, continuous monitoring makes it possible to measure gases, volatile organic compounds and particulate matter in real time.
How real-time atmospheric monitoring works during an emergency
Real-time emergency environmental monitoring can be understood as a sequence of eight steps. Not every incident goes through all of them, but they describe the path from detection to final verification.
1. Establish normal background conditions
A permanent emergency environmental monitoring network records the baseline at each point. It shows which concentrations are usual, at what times they rise and how traffic, processes or weather influence them. This reference makes it possible to tell a normal variation from a real anomaly, which is impossible if measurement only starts when the problem is already visible.
2. Detect an abnormal concentration
The system identifies three possible situations:
- A sudden increase.
- A pattern that departs from usual behaviour.
- Exceedance of a previously defined threshold.
Each of these situations may point to a different problem, which is why it is advisable to combine more than one criterion.
3. Generate an alert
The alert reaches those who need to assess it, usually the people in charge of the environment, operations, health and safety, and emergencies. It is important not to confuse an environmental alert with a safety-critical alarm. The former warns of an environmental deviation that needs investigating. The latter belongs to systems designed and certified to protect lives immediately, and an environmental monitoring network does not replace them.
4. Compare different measurement points
If a sensor network is in place, comparing stations provides information that a single point cannot. It shows where the increase appears first, where the highest concentration is measured and which stations remain unchanged. That spatial pattern helps delimit the extent or affected area and steer the investigation towards the probable source.
5. Integrate meteorology
Meteorological parameters are essential for interpreting any air qualityAir quality refers to the state of the air we breathe and its composition in terms of pollutants present in the atmosphere. It is considered good when poll...
Read more data. In particular, wind direction and speed make it possible to estimate the probable path of the plume, identify downwind areas and guide the search for the source area of the emissions. Dispersion conditions (atmospheric stability, temperature and humidity) also explain why the same emission can be barely noticeable one day and clearly visible the next.
6. Add modelling when necessary
When scenarios need to be projected, dispersion models play a complementary role. Dispersion models, such as those based on the Gaussian plume, plume tracking techniques or tools such as ALOHA (Areal Locations of Hazardous Atmospheres), developed by the US Environmental Protection Agency (EPA) and the National Oceanic and Atmospheric Administration (NOAA), make it possible to estimate how the situation could evolve.
7. Confirm with complementary techniques
Continuous environmental monitoring sensors indicate that something is happening and, when necessary, more specific analytical techniques confirm what it is. Depending on the incident, confirmation may come from a mobile laboratory, gas sampling canisters, sorbent tubes for VOCs, specific analysers or conventional laboratory analysis.
8. Verify the return to normal
Once the environmental incident is under control, subsequent monitoring checks that concentrations are falling, that corrective measures have worked and that the environmental baseline is recovered. It also leaves a record of the complete incident, useful for the environmental report and for reviewing the industrial procedure.
-
01
Establish the baseline
A permanent network records the usual concentrations at each point and how traffic, processes and weather influence them.
Key point: without knowing the usual concentrations of an industrial process, it is difficult to identify when something starts to go wrong.
-
02
Detect the anomaly
Sudden increase, deviation from the usual pattern or exceedance of a defined threshold. It is best to combine criteria.
-
03
Generate an alert
Notice to environment, operations, safety and emergency teams. It flags a deviation that needs investigating.
Key point: an environmental alert does not replace the certified systems that protect lives immediately.
-
04
Compare measurement points
Where it rises first, where the highest reading is and which stations do not change. It delimits the affected area and points towards the source.
-
05
Integrate meteorology
Wind direction and speed estimate the path of the plume. Stability, temperature and humidity explain the dispersion.
-
06
Model scenarios
If applicable
Gaussian plume, plume tracking or ALOHA (EPA and NOAA) project how the situation may evolve.
Key point: a dispersion model projects from input assumptions and must be validated against observed data.
-
07
Confirm with analytical techniques
If applicable
Mobile laboratory, canisters, sorbent tubes for VOCs or specific analysers confirm which substance it is.
-
08
Verify the return to normal
Concentrations fall, the measures work and the baseline is recovered. The complete incident is recorded.
Hover over or tap each step to see the detail.
Threshold alerts: turning data into decisions
A reading on a screen changes nothing if nobody knows what to do with it. Threshold alerts turn a reading into a signal with a recipient and an associated action, but for that to work you need to define carefully what each threshold means.
Not all thresholds mean the same thing
The same gas can have very different thresholds depending on the objective. For hydrogen sulphide, the EPA gives an odour perception level of 0.01 ppm (10 ppb), while the Acute Exposure Guideline Level AEGL-1 for 10 minutes is 0.75 ppm (750 ppb) and the AEGL-2 for the same time rises to 41 ppm. Between the first odour and the threshold for incapacitating effects there are more than three orders of magnitude, so an alert designed to warn of odours and another designed to protect health must be configured separately.
Before configuring an alert, it is worth distinguishing four types of threshold, because each one answers a different question:
| Type of threshold | What it is for |
|---|---|
| Operational threshold | Detect deviations from normal behaviour |
| Regulatory environmental threshold | Assess regulatory compliance |
| Occupational exposure limit | Worker protection |
| Acute exposure threshold | Support decisions during accidental exposures |
Mixing them up causes common errors. A regulatory threshold is rarely useful for detecting an incipient leak, because it is exceeded when the problem is already serious. An operational threshold, by contrast, is set from the site’s own baseline and warns much earlier.
AEGL and acute exposure
Acute Exposure Guideline Levels (AEGLs) are reference values published by the EPA to support decision-making during accidental releases of chemical substances. They set out three levels of severity of effects and several exposure durations, from minutes to hours.
These levels are designed for short-term accidental exposures. They depend on both concentration and exposure time, not on concentration alone. They are also not equivalent to ordinary environmental limits or occupational values, so they should not be used to assess everyday regulatory compliance. Each substance has its own values, so they should be checked at the source when analysing a specific case.
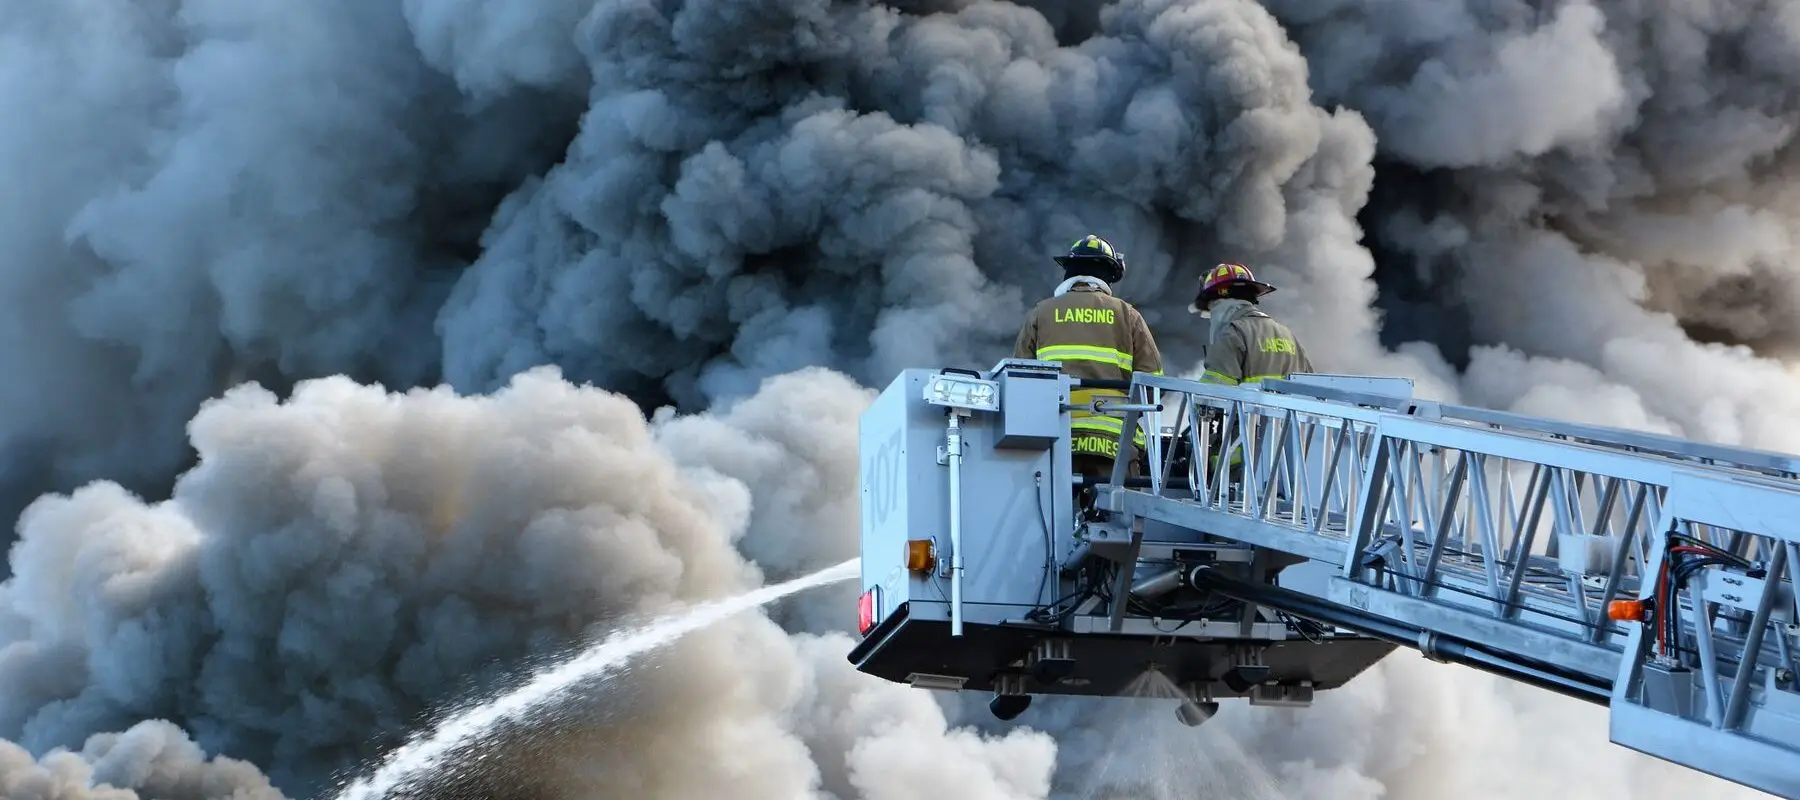
Not all environmental incidents have an atmospheric component, but in those that do, time is critical.
Why real-time data can speed up the response
Uncertainty when responding to an environmental emergency consumes valuable time and can also cause irreversible environmental damage. Fast, continuous measurement distributed across a facility is not a theoretical idea. Several environmental authorities have already incorporated it into their emergency protocols, with different approaches.
The sooner reliable information is available in an environmental emergency, the less time is spent working out what is happening and the more time remains to decide how to respond appropriately.
In an accidental release of toxic gases, the moment of action determines which measures remain effective. Jiang et al. (2022).
US EPA
The EPA’s Environmental Response Team (ERT) uses real-time instrumentation, mobile systems, sampling and rapidly deployable equipment to respond to chemical and environmental emergencies. Its environmental alert system capabilities make it possible to monitor pollutants such as Cl2, H2S, NH3, HF, VOCs, benzene and particulate matter.
It also provides for triggering additional sampling in response to specific events, such as when sensors exceed a value, when the wind changes or when predetermined conditions are met, known as event-triggered monitoring, which is an effective model.
Atmo France and the AASQA
In France, the approved associations for air quality monitoring (AASQA), coordinated by Atmo France, develop response arrangements for accidental situations at industrial sites. They combine rapid intervention, sampling, microsensors, drones and modelling, with regional, pooled teams to provide a coordinated response where it is needed.
Atmo Normandie and CASPAIR
Atmo Normandie works with the CASPAIR programme to prepare for industrial fires, abnormal atmospheric episodes and incidents. It is a notable example because its goal is to have measurements available from the first hours and to test new monitoring solutions that improve regional response capacity.
Atmo Hauts-de-France
Atmo Hauts-de-France has a pooled emergency system for accidental contamination, geared towards anticipation and rapid intervention.
This emergency system is shared with state services, fire brigades and numerous industrial companies in the region. The authorities can activate it after a chemical accident to assess its impact on air quality and to inform the public during follow-up and the subsequent phase.
AtmoSud
During the industrial fire in Carros in 2026, AtmoSud combined its permanent network, additional sensors and dispersion modelling. It is an illustrative example of a hybrid architecture in which the fixed network provides the baseline and continuity, complementary sensors cover the areas of interest and the model estimates the extent of the plume, allowing a more complete response during an environmental emergency.
South Coast AQMD
The South Coast Air Quality Management District (AQMD) in California uses real-time mobile monitoring, meteorology, modelling and community stations together to deal with chemical emergencies. This approach has a practical advantage: the data collected during the incident helps decide where to deploy more equipment, making the best use of available resources.
UNEP and OCHA
At international level, the Joint Environment Unit of the United Nations Environment Programme (UNEP) and the Office for the Coordination of Humanitarian Affairs (OCHA) offers rapid environmental assessments, at the request of countries affected by large-scale disasters and complex emergencies.
These use the Flash Environmental Assessment Tool (FEAT) to identify and map the acute risks posed by hazardous chemicals released after a sudden disaster. The unit can also mobilise technical experts within 48 hours to carry out detailed assessments over two or three weeks, and its response mechanism includes sampling and analysis in the field. Its contribution centres on rapid assessment and sampling, not on maintaining a permanent air monitoring network.
| Organisation | Application | Tools |
|---|---|---|
| US EPA | Chemical and environmental emergencies | Real-time monitoring, mobile systems, sampling and event-triggered monitoring. |
| Atmo France and AASQA | Industrial accidents | Rapid sampling, microsensors, drones and modelling. |
| Atmo Normandie (CASPAIR) | Industrial fires and abnormal atmospheric episodes | Advance preparation, measurements from the first hours and testing of new monitoring solutions. |
| Atmo Hauts-de-France | Chemical accidents | Emergency system shared with the state, fire brigades and industry, to measure, assess impact and inform the public. |
| AtmoSud | Industrial fires | Permanent network, additional sensors and dispersion modelling. |
| South Coast AQMD | Chemical emergencies | Real-time mobile monitoring, meteorology, modelling and community stations. |
| UNEP and OCHA | Environmental disasters | Rapid assessment (FEAT), deployable experts, sampling and analysis in the field. |
Environmental consultancies are also adopting real-time atmospheric monitoring
The trend towards real-time atmospheric monitoring is not limited to public authorities. More and more environmental consultancies are building emergency response capabilities for incidents involving air pollution, with mobile units, real-time monitoring, analytical sampling, modelling and rapid reporting among their services.
Some companies, such as CleanAir, maintain an on-call programme with a guaranteed response in 12 or 24 hours, which combines real-time measurement with canister sampling (whole-air sampling containers) or sorbent traps and offers cloud-based dispersion modelling. Although these are not scientific references, they do suggest that the professional sector already works with this model of evidence-based solutions built on continuous data to complement traditional environmental consultancy approaches.
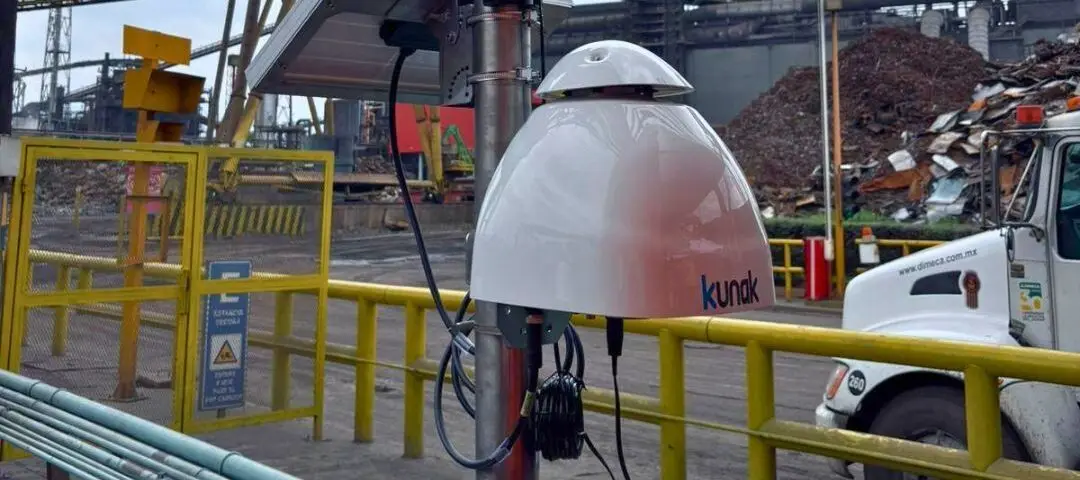
Kunak fenceline monitoring station at a steel plant.
Continuous monitoring as a preventive layer
So far, the article has covered the steps for responding to an incident. Now it is time to look at the other half: preparedness. This is not an environmental emergency response in the strict sense, but environmental preparedness at an industrial facility where incidents can evolve quickly.
The case of Ternium Mexico, part of the Techint group and one of the largest steel producers in Latin America, illustrates perfectly how industrial fire and emissions monitoring does not have to be limited to the response during the environmental emergency, but can work as a layer of environmental preparedness.
Ternium uses continuous fenceline monitoring at its Las Encinas and Guerrero plants to measure particulate matter (from PM1 to PM10, as well as total suspended particles and total particle count), sulphur dioxide (SO2)Sulphur dioxide (SO2) is a colourless gas with a pungent odour that causes an irritating sensation similar to shortness of breath. Its origin is anthropoge...
Read more, nitrogen dioxide (NO2), carbon monoxide (CO)The carbon monoxide (CO) is an invisible gas (colorless and odorless) that, at the same time, is a silent killer because in just a few minutes it exhibits ...
Read more, ozone (O3) and meteorological variables, including wind speed and direction. It also has early warning systems that make it possible to detect deviations and react quickly before a minor problem turns into a major emergency.
The alert system is configured in line with the limits set by Mexican regulations, and the correlation between concentration and wind makes it possible to attribute each episode to a specific source. With this information, the environmental team identifies the patterns linked to particular industrial processes and triggers corrective measures with shorter response times.
Periodic inspections are still necessary. Continuous monitoring adds visibility between one inspection and the next, so the plant no longer depends solely on discovering an anomaly during a scheduled review. In general terms, this approach makes it possible to reduce detection time, prioritise inspections, point to the processes that should be reviewed, assess perimeter impact and check that concentrations recover after a corrective measure.
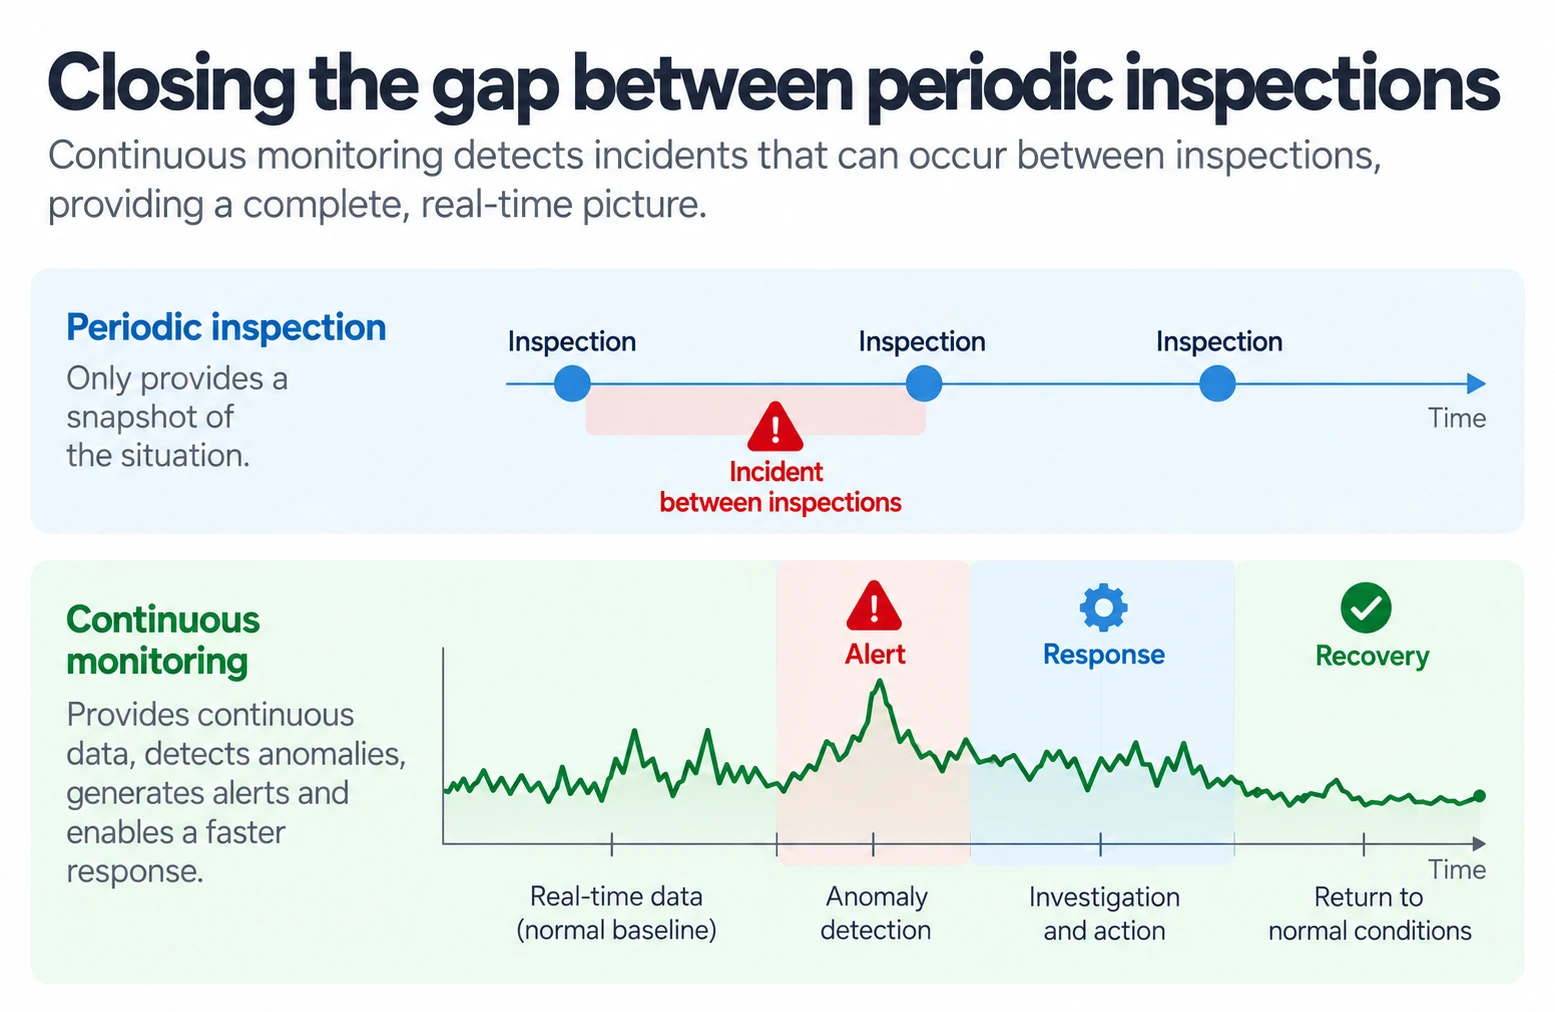
A periodic inspection only offers a snapshot of the situation. Continuous monitoring detects the incident that occurs between two visits and records the alert, the response and the return to normal.
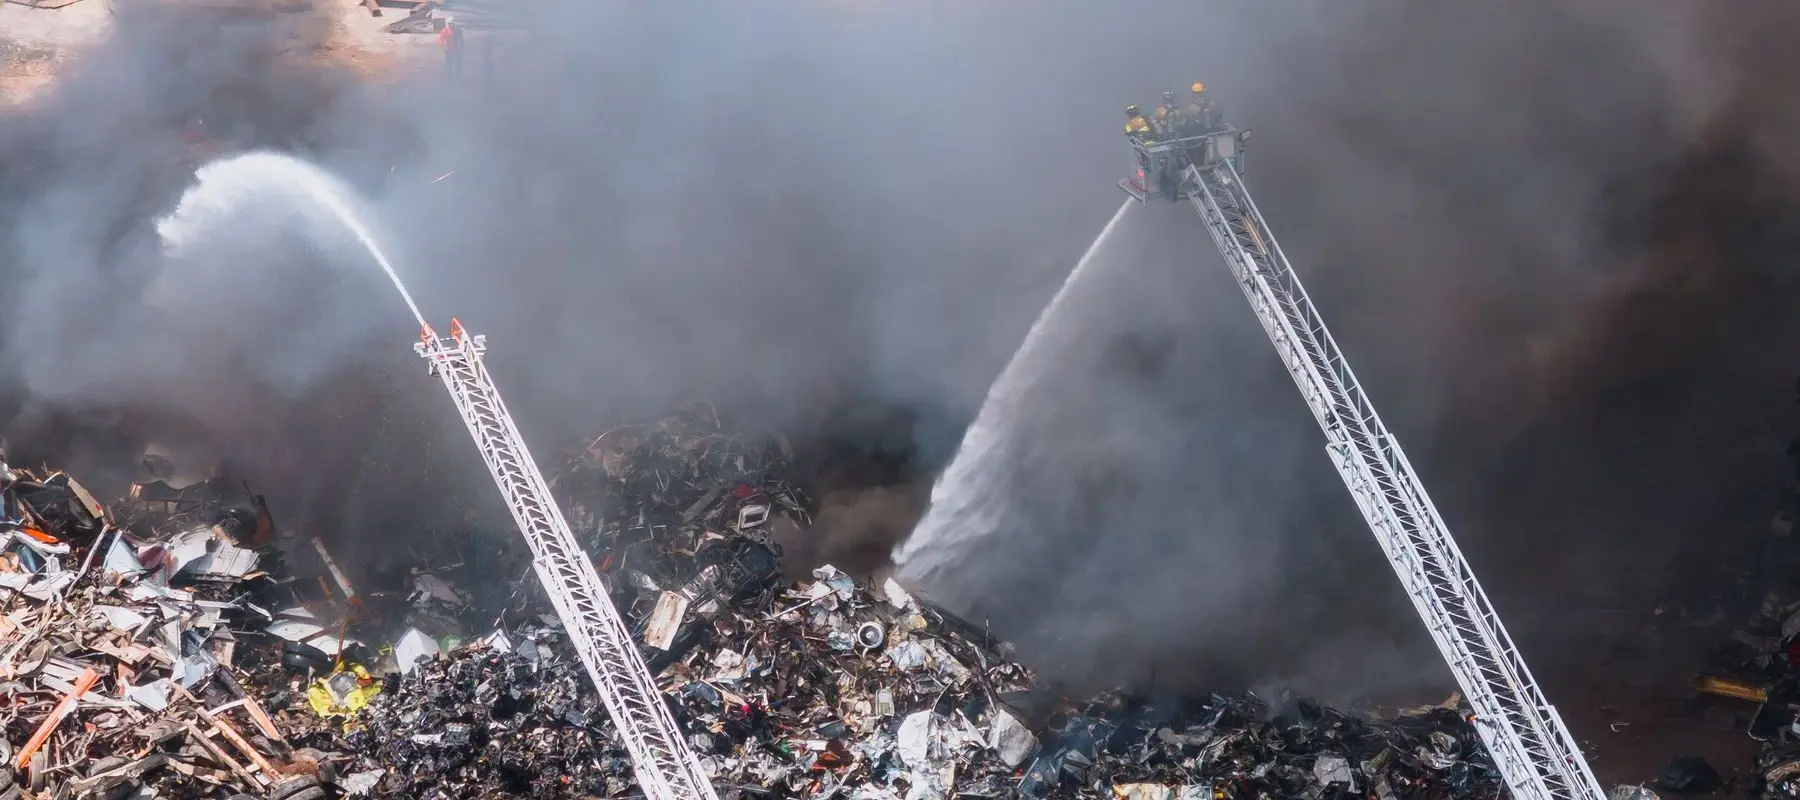
Every environmental emergency has its own characteristics.
No single technology can cover every emergency on its own
Each environmental emergency response technique answers a different question, and none answers them all. A portable instrument arrives quickly but covers little space. A reference analyser measures with high metrological quality but is not easy to move. That is why it is worth knowing what role each tool plays, and its limitations, before an incident occurs. No single technology offers the complete answer.
| Technology | Advantage | Limitation | Role |
|---|---|---|---|
| Portable instrument | Fast response | Limited coverage | First assessment |
| Sensor network | Continuity and coverage | Depends on the pollutant | Alerting and follow-up |
| Mobile laboratory | High specificity | Slower and more expensive | Confirmation |
| Canister / tubes | Detailed analysis | Not immediate | Analytical evidence |
| Reference analyser | High metrological quality | Low mobility | Validation |
| Drone / remote sensing | Access and mapping | Specialised | Plume investigation |
| Dispersion model | Spatial prediction | Not a measurement | Projection and scenarios |
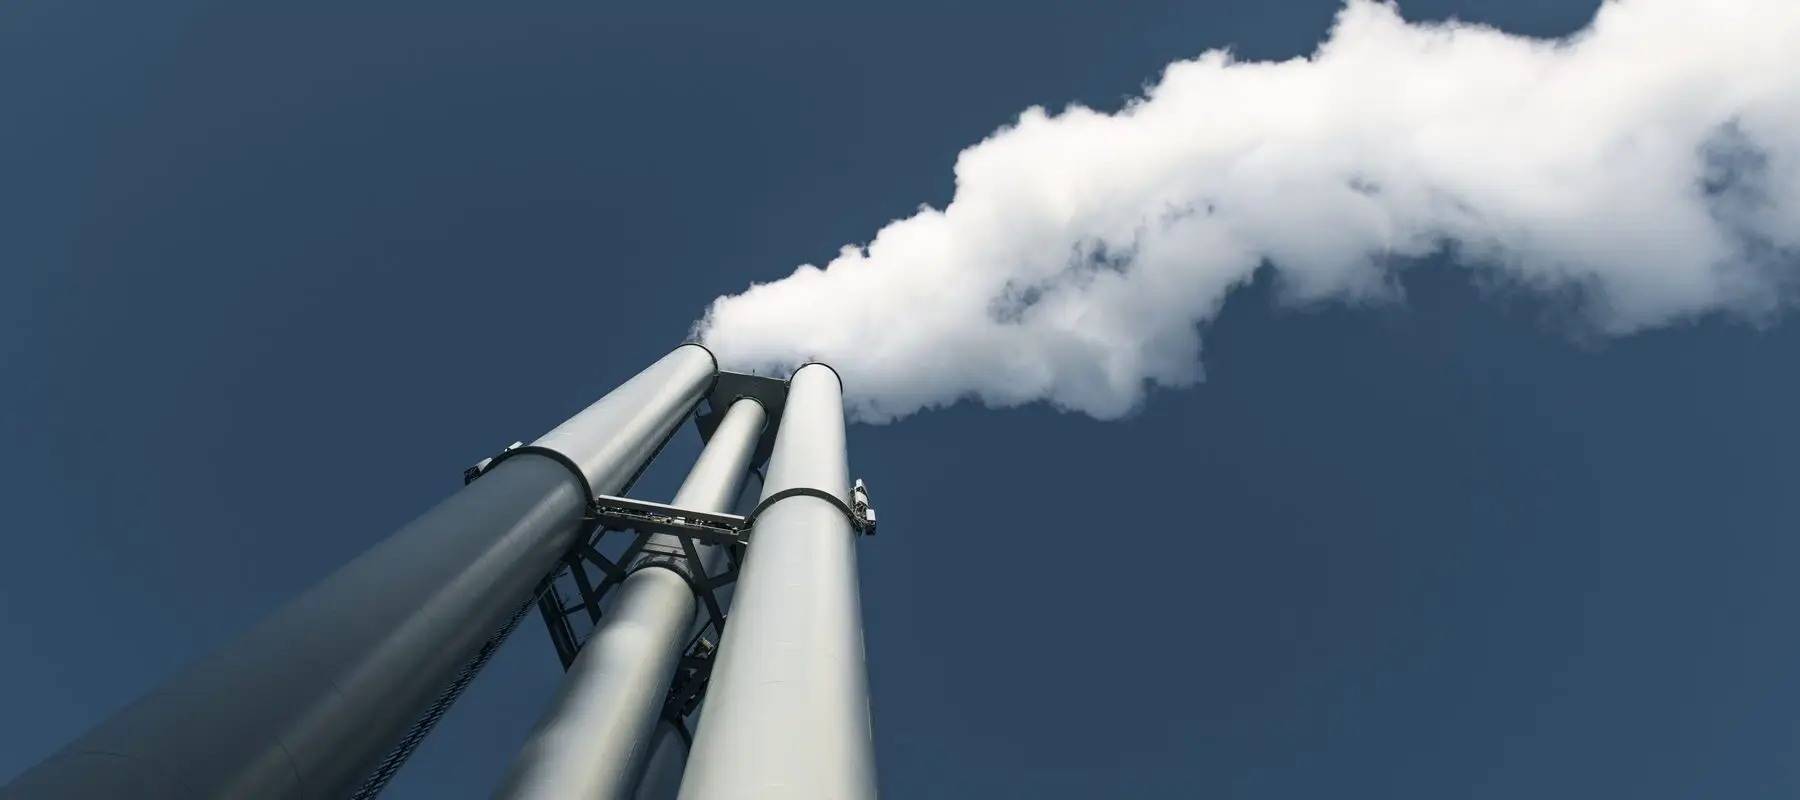
An environmental emergency is a sudden or uncontrolled situation that can cause significant, irreversible damage to the environment, to human health or to both.
How to design a monitoring plan before an emergency occurs
An emergency is not the time to decide what to measure, where or who acts. Each decision in the plan answers a specific question effectively, and it is best to plan them calmly, before any incident occurs, so that you can act quickly and safely if needed.
Identify the potential pollutants
The starting point is the facility’s own chemical inventory, taking into account raw materials, products, processes and waste. Combustion and decomposition products must be added, because a material that is harmless in storage can generate very different compounds when it burns or degrades.
Establish the baseline
Before an anomaly can be detected, you have to know what is normal at each point. The baseline records the usual concentrations, their variations throughout the day and their relationship with processes, traffic or weather. The more representative the recorded period, the more reliable the comparison when something changes.
Select fixed and rapid deployment locations
Fixed points provide continuity and are placed at the perimeter, upwind and downwind, and next to sensitive receptors such as homes, schools or healthcare centres. Rapid deployment points cover whatever the incident goes on to show, including mobile areas. The reason is practical: the wind changes direction. For example, in the Carros fire on 12 March 2026, one sensor again recorded high concentrations after the wind shifted from north to south, while the sensor upwind of the fire was not affected.
Integrate meteorology
Integrating meteorological parameters, such as wind direction and speed, is essential, because without them a high concentration does not show where it comes from or where it is heading. Temperature and, where relevant, atmospheric stability (how much the air mixes vertically) explain why the same emission dilutes quickly one day and accumulates the next.
Define thresholds in advance
The plan drawn up before an environmental emergency should set at least two levels. The warning threshold indicates a deviation that needs checking. The escalation threshold indicates that the situation requires activating the emergency procedure.
For each one, you must decide who receives the alert and what action is attached to it, so that nobody has to improvise when the warning goes off. It is worth remembering that each threshold serves a different objective, as we saw when comparing operational, regulatory, occupational and acute exposure thresholds.
Define confirmation methods
You need to establish in advance how sensor alerts will be confirmed. A fast sensor indicates that something is happening, but not always what it is. That is why the plan should set out beforehand which technique confirms each type of incident, whether a portable instrument, a mobile laboratory, canisters or sorbent tubes. This avoids deciding on the spot how an alert is verified.
Define responsibilities
The plan must name the people who validate the alert, investigate it, communicate, decide and document what happened. They can be different profiles, but every task needs an owner and a deputy.
Rehearse the procedure
A plan that has never been tested has weak points that only appear at the worst moment. Drills make it possible to check that the alert reaches whoever it should, that thresholds do not generate unnecessary warnings and that everyone knows their role before a real event.
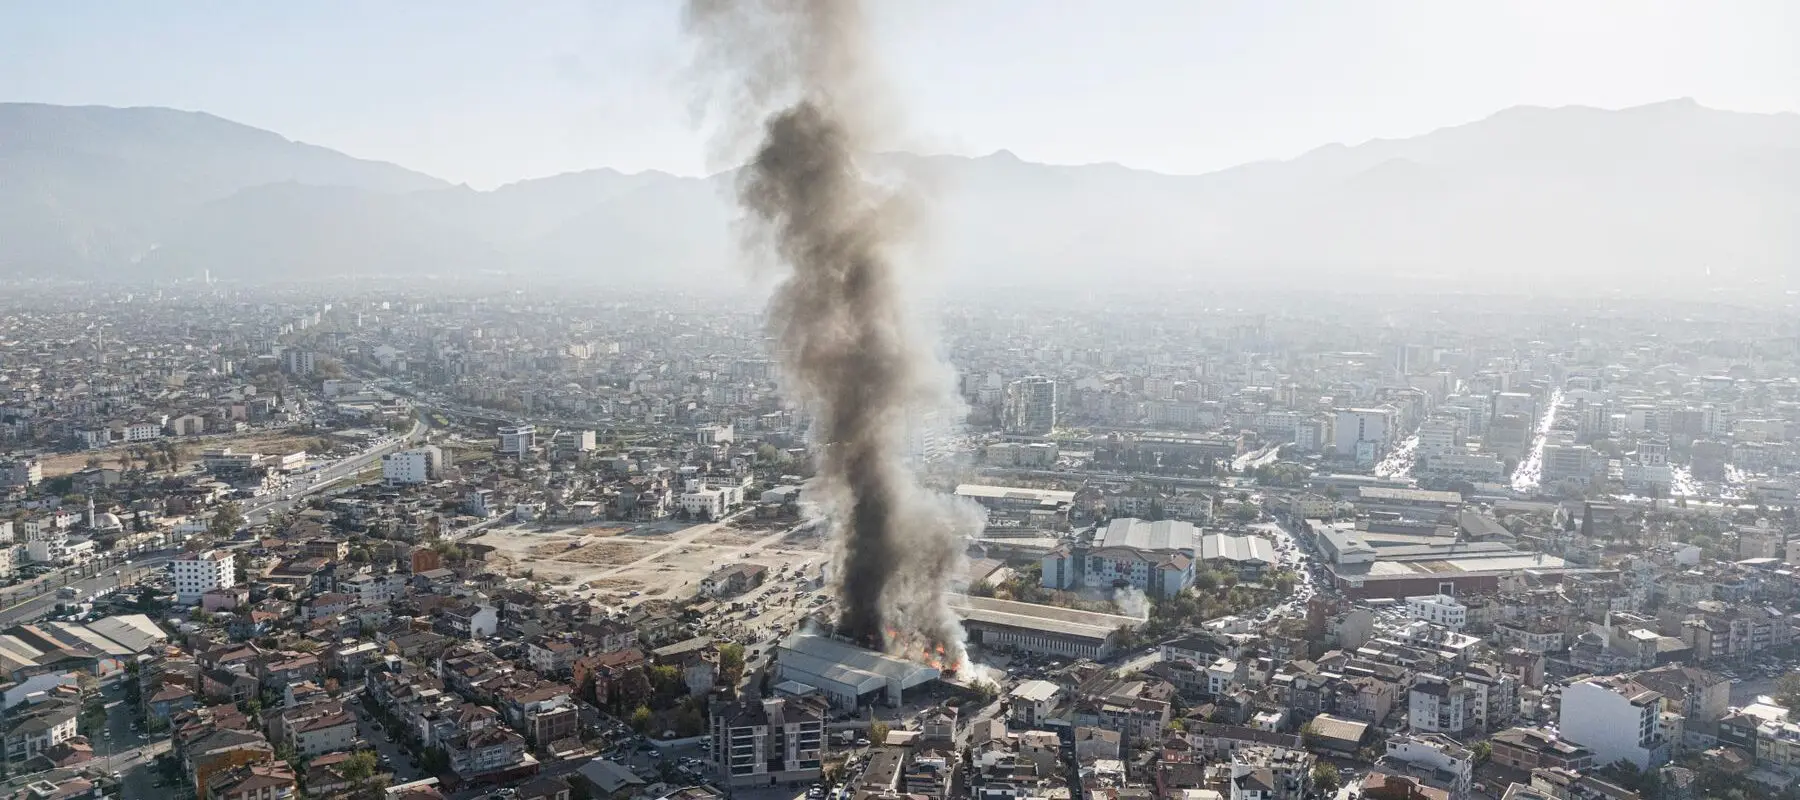
Environmental emergency monitoring turns the uncertainty of the first moments of an incident into observed data, allowing those in charge to make decisions based on evidence rather than on assumptions or theoretical scenarios alone.
Data quality matters even more during an emergency
In an environmental emergency, decisions are made in a hurry, sometimes with consequences for people, and there is no room to doubt the data readings. The following table sets out the aspects worth knowing about any sensor before incorporating it into an environmental emergency response plan.
| Aspect | Why it matters in an emergency |
|---|---|
| Limit of detection | If it is higher than the levels of interest, the sensor does not detect the initial phase of the incident. |
| Measurement range | If the concentration exceeds it, the reading saturates and no longer reflects the real value. |
| Response time | Determines how long a change takes to show up and, therefore, when the alert is triggered. |
| Interferences | Smoke contains many compounds, and some can alter the reading of other gases. |
| Temperature and humidity | They can affect the signal if the sensor does not compensate for them. |
| Calibration | Ensures that the reading is comparable with a reference and traceable. |
| Connectivity and data availability (uptime) | Without continuous data there is no alert, and a communication failure is equivalent to a blind spot. |
| Quality assurance and quality control (QA/QC) | Makes it possible to validate data and distinguish a real signal from a fault. |
| Uncertainty | Indicates the margin of error with which the decision is made. |
These sensor aspects show up as two types of error. A false negative occurs when the system gives no warning and there is a problem, creating false reassurance. A false positive occurs when it warns and there is no problem, causing unnecessary mobilisations and, over time, leading to alerts no longer being taken seriously. A well-designed plan seeks a balance between the two and reviews it with real data from each site.

Sensor networks complement conventional sampling and periodic inspections with threshold alerts and incident tracking and support, so that decisions during an environmental emergency are based on observed data.
What a sensor network can and cannot do
Setting the scope of a monitoring network clearly is what gives the tool credibility. Excessive expectations lead to disappointment, and expectations that are too low leave useful information unused.
What a sensor network can do
A sensor network detects anomalies, generates alerts and tracks the evolution of an environmental emergency response episode. It also makes it possible to compare areas, integrate meteorology and study how a pollutant disperses. With that information, it helps identify the probable source areas and, when the incident ends, check that concentrations return to normal.
What a sensor network cannot do on its own
A sensor network does not replace safety-critical systems, which are designed and certified to protect lives immediately. Nor does it replace personal detectors or mandatory ATEX systems (equipment and protective systems for potentially explosive atmospheres, under European regulations). It does not identify every compound, does not replace laboratory analysis and does not automatically demonstrate causality between a source and an incident. Finally, it does not decide evacuations; it only provides data for those who hold that responsibility.
In the accident reports collected by the European eMARS system, emergency measures do not always mean evacuating: in the case of toxic releases, the most likely advice is to stay indoors and seal the home. Major Accident Hazards Bureau, Joint Research Centre (n.d.).
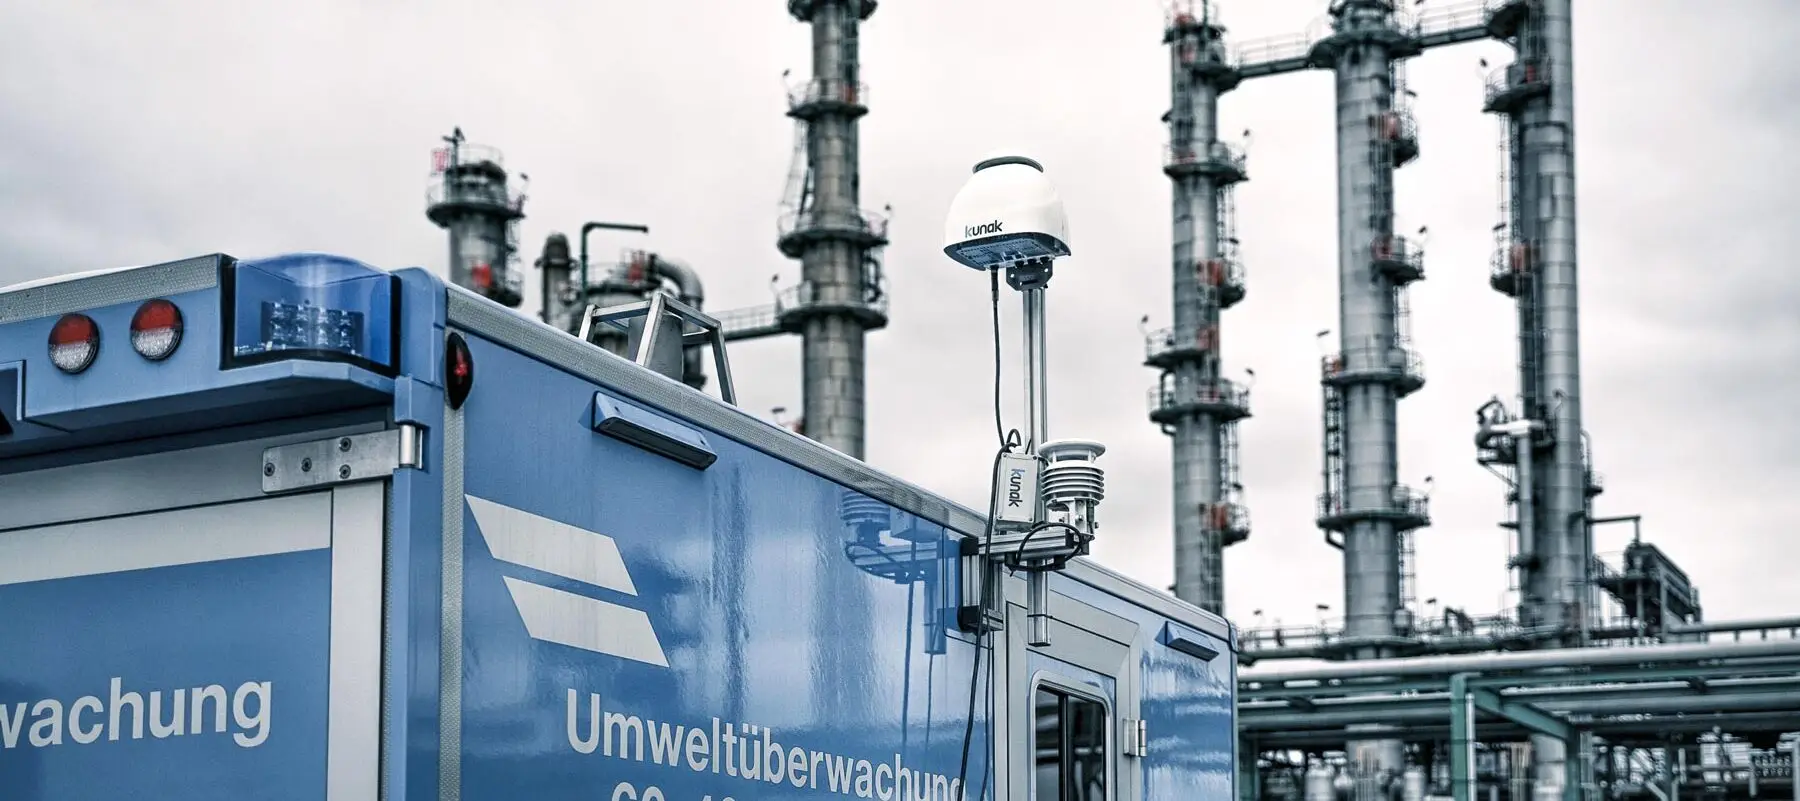
Kunak AIR station at an industrial site, with real-time gas, particulate matter and meteorological data.
How Kunak can contribute to environmental emergency response
Kunak AIR can provide the continuous environmental monitoring layer within a wider preparedness and response strategy for environmental emergencies. It does not replace safety systems, personal detectors or the laboratory. It adds a permanent reading of what is happening in the air, with data that can be compared between points.
Kunak AIR Pro and Kunak AIR Lite
Kunak AIR Pro and Kunak AIR Lite measure gases, particulate matter and meteorology in a single unit. Each sensor sits in a smart cartridge that stores its identity and factory calibration, and it is replaced in minutes without dismantling the station. Data reaches Kunak AIR Cloud in real time via GPRS, 3G, 4G or Ethernet, and solar panel and battery power makes it possible to install the stations where there is no mains supply, a common situation in an emergency deployment.
Kunak AIR Pro supports up to six meteorological probes and the more compact Kunak AIR Lite up to two, which makes it easier to densify the network at hyperlocal scale. With several stations deployed and wind data, it is possible to compare points and follow how an incident moves.
Kunak AIR Cloud
Kunak AIR Cloud is the web platform that receives the data from the stations. It shows on a map the status of each unit and its latest measurements, lets you configure threshold alerts and generates automatic reports for a single station or for the whole network. Pollution roses and polar plots on the map show from which direction the highest concentrations arrive, which is useful for narrowing down possible sources. Data can be exported in different formats or shared via API with the systems the organisation already uses, and the platform also accepts data from other sources.
The platform also underpins the data quality described above: it applies temperature and humidity compensation, corrects baseline and drift, validates data and maintains its traceability.
Before: baseline and thresholds
Once the network is installed, the accumulated data defines the baseline and trends at each point. From there, warning and escalation thresholds are configured and anomalies are detected before they become an incident.
During: real-time data and follow-up
When a concentration exceeds a threshold, the alert reaches the people responsible defined in the plan. The map makes it possible to compare station measurements, and the combination of concentration and wind shows where the incident is heading. That information guides where to deploy additional equipment and which confirmation technique to use.
After: verification and reconstruction of the incident
The historical record makes it possible to check when the baseline is recovered, to verify whether corrective measures have worked and to reconstruct the sequence of the incident.
Before, during and after an environmental emergency
What continuous monitoring provides in each phase of the incident.
Before
Preparedness
Baseline
Normal conditions at each point.
Continuous monitoring
Permanent surveillance of gases, particulate matter and meteorology.
Thresholds and alerts
Warning and escalation levels defined in advance.
Planning
Responsibilities, confirmation methods and drills.
During
Response
Alert
Automatic detection of deviations.
Real-time data
Concentrations and trends by station.
Spatial comparison
Which points record the increase first.
Wind
Direction and speed to track the plume.
Rapid response
Deployment of teams and control measures.
After
Recovery
Return to baseline
Follow-up until normality is recovered.
Verification
Effectiveness of corrective measures.
Incident reconstruction
Start, duration, peak concentration and evolution.
Report
Documentation and communication to the authorities.
Real-time monitoring is changing environmental emergency response
For a long time, environmental response has focused on mobilising resources after an incident, such as sampling teams, experts and laboratories that arrive when the incident is already under way. Those capabilities remain essential, but authorities and companies alike are now evolving towards combining preparedness, permanent monitoring, rapid response and subsequent verification. An effective environmental emergency response does not begin only once the incident has started. A continuous air monitoring network establishes what is normal before the incident, warns when something deviates, guides where to measure in more detail and, in the end, confirms that the situation has recovered. It is an evolution that does not replace traditional tools (periodic inspections, safety systems, confirmatory sampling, modelling) but complements them, creating a more robust and resilient environmental defence system. Each phase relies on the others, and no single technique covers them all.
What is environmental emergency response?
Environmental emergency response is the set of actions aimed at quickly identifying the pollutants released in an industrial accident, a fire or a leak, delimiting the affected areas, protecting workers and the public and verifying the return to normal. When the incident affects the air, a continuous monitoring network measures gases, VOCs and particulate matter in real time and, combined with wind data, shows where the plume is moving. This information complements, without replacing, safety systems, confirmatory sampling and dispersion modelling.
FAQs about environmental emergency response
What is emergency atmospheric monitoring?
It is the continuous or rapid measurement of atmospheric pollutants during accidental episodes or situations of environmental risk, such as industrial fires, toxic gas leaks or spills that volatilise. Its purpose is to provide real-time data to assess the situation, follow its evolution and support response decisions. It can rely on a fixed network that is already operating before the incident, on portable or mobile equipment deployed in the field and on additional stations installed where the incident requires them. The permanent network also provides the baseline, that is, the usual concentrations at each point, without which it is difficult to distinguish a real anomaly from a normal variation. The data is combined with meteorology, confirmatory sampling and dispersion modelling.
Which pollutants should be measured during an industrial accident?
It depends on the type of incident and the substances present at the facility, so the selection must start from the chemical inventory and the specific processes, including products that may form through combustion or decomposition. In an industrial fire, the usual measurements are particulate matter (PM2.5 and PM10), CO, NO2, SO2 and volatile organic compounds (VOCs). In a gas leak, the usual parameters are H2S, NH3, SO2, Cl2, HCl, HF and CH4, the latter because of its flammability risk. In chemical or petrochemical spills, VOCs, TVOCs and the compounds specific to the spilled product are of interest. In all cases, it is worth recording wind direction and speed, temperature, humidity and pressure, because without them it is not possible to interpret the origin or the path of the plume.
How are alert thresholds set?
Thresholds are defined before any emergency by combining several criteria: normal operating concentrations (baseline), the applicable regulatory values, occupational exposure limits and reference levels for acute exposures, such as the AEGLs published by the EPA. Each one answers a different question. An operational threshold, set from the site’s baseline, detects early deviations, whereas a regulatory threshold is usually exceeded when the problem is already serious. For H2S, for example, the odour perception level is 0.01 ppm and the 10-minute AEGL-2 reaches 41 ppm, so odour alerts and health alerts must be configured separately. The plan should set at least one warning threshold and one escalation threshold, with recipients and associated actions, and review them periodically with real data from the site.
Can sensors replace emergency detectors?
No. Environmental sensor networks complement, but do not replace, safety-critical systems, which are designed and certified to protect lives immediately. Nor do they replace workers’ personal detectors or the mandatory ATEX systems in potentially explosive atmospheres. An environmental alert warns of a deviation that needs investigating, whereas a safety alarm triggers an immediate, protocol-based response. The sensor network provides what those systems do not cover: a continuous reading of the air at the perimeter and in the surroundings, comparable between points, useful for detecting incidents between inspections, following the plume and verifying the return to normal. The most effective strategies combine several layers of protection, each with its own function.
How does wind help track a pollution plume?
Wind direction and speed determine where a pollutant plume moves and how it disperses. Without that data, a high concentration indicates that something is happening, but not where it comes from or which areas it may reach. By cross-referencing the concentration measured at each station with the wind at that moment, it is possible to estimate the probable path, delimit the downwind areas that may be affected and guide the search for the source of the emission. Atmospheric stability, temperature and humidity help explain why the same emission dilutes quickly one day and accumulates the next. In Kunak AIR Cloud, pollution roses and polar plots show from which direction the highest concentrations arrive, which makes it easier to narrow down possible sources.
References
- Danforth, C. G., Portier, C., Ensor, K. B., Hopkins, L., Evans, B., Quist, A. J. L., McGraw, K. E., and Craft, E. (2024). Development and demonstration of a data visualization platform of short-term guidelines for ambient air levels of benzene during disaster response in Houston, Texas. Integrated Environmental Assessment and Management, 20(2), 533-546. https://doi.org/10.1002/ieam.4814
- Duan, J., Mao, S., Xie, P., Lang, J., Li, A., Tong, J., Qin, M., Xu, J., and Shen, Z. (2023). Key emergency response technologies for abrupt air pollution accidents in China. Journal of Environmental Sciences, 123, 235-254. https://doi.org/10.1016/j.jes.2022.03.030
- Jiang, Y., Xu, K., Gai, W., and Salhi, S. (2022). Emergency response for tackling major accidental toxic gas releases: What should be done and when? Safety Science, 154, 105819. https://doi.org/10.1016/j.ssci.2022.105819
- Karagulian, F., Barbiere, M., Kotsev, A., Spinelle, L., Gerboles, M., Lagler, F., Redon, N., Crunaire, S., and Borowiak, A. (2019). Review of the performance of low-cost sensors for air quality monitoringControlling air quality is an essential task in order to enjoy optimal environmental conditions for healthy human development and to keep the environment i...
Read more. Atmosphere, 10(9), 506. https://doi.org/10.3390/atmos10090506 - Karellas, N. S., Chen, Q. F., De Brou, G. B., and Milburn, R. K. (2003). Real time air monitoring of hydrogen chloride and chlorine gas during a chemical fire. Journal of Hazardous Materials, 102(1), 105-120. https://doi.org/10.1016/S0304-3894(03)00205-X
- Kendler, S., and Fishbain, B. (2022). Optimal wireless distributed sensor network design and ad-hoc deployment in a chemical emergency situation. Sensors, 22(7), 2563. https://doi.org/10.3390/s22072563
- Manes, G., Collodi, G., Fusco, R., Gelpi, L., and Manes, A. (2012). Continuous remote monitoring in hazardous sites using sensor technologies. International Journal of Distributed Sensor Networks, article 317020. https://doi.org/10.1155/2012/317020
- Manes, G., Collodi, G., Gelpi, L., Fusco, R., Ricci, G., Manes, A., and Passafiume, M. (2016). Realtime gas emission monitoring at hazardous sites using a distributed point-source sensing infrastructure. Sensors, 16(1), 121. https://doi.org/10.3390/s16010121
- Papaconstantinou, R., Demosthenous, M., Bezantakos, S., Hadjigeorgiou, N., Costi, M., Stylianou, M., Symeou, E., Savvides, C., and Biskos, G. (2023). Field evaluation of low-cost electrochemical air quality gas sensors under extreme temperature and relative humidity conditions. Atmospheric Measurement Techniques, 16(12), 3313-3329. https://doi.org/10.5194/amt-16-3313-2023
- US EPA (2024). Air monitoring summary tables: BioLabs chlorine fire. https://www.epa.gov/system/files/documents/2024-10/biolabchlorine_datasummaryreport_20241017_5pm.pdf
- Houston Health Department (2020). Benzene air pollution action levels [presentation]. https://311.houstontx.gov/council/committees/qol/20201217joint/Benzene-Air-Pollution-Action-Levels.pdf
- Major Accident Hazards Bureau, Joint Research Centre (n.d.). Learning from emergency response: eMARS and other accident sources (Bulletin No. 10, part 1). https://minerva.jrc.ec.europa.eu/en/shorturl/minerva/jrc105148mahb_bulletin_no10_emergency_responsepart1pdf