
Choosing the right air qualityAir quality refers to the state of the air we breathe and its composition in terms of pollutants present in the atmosphere. It is considered good when poll...
Read more sensor for a project takes more than comparing price, number of pollutants or battery life. The choice should start from the monitoring objective, the pollutants and concentration ranges expected, the installation environment and the data quality required. It is also worth checking the sensor’s precision, calibration, traceability and behaviour under changing temperature, humidity, interferences and drift, as well as whether it holds certifications, follows recognised protocols and has been independently evaluated. Finally, maintenance, connectivity, software, support and total cost of operation all need to be weighed up. There is no universally best sensor: there is the most suitable one for each application and required performance level.
Every year more manufacturers enter the environmental monitoring market, and all of them promise precision, reliability and results comparable to reference instrumentation. The range on offer is huge, from consumer devices to professional monitoring systems, and comparisons usually start with price, number of parameters, battery life or design. These are all useful factors, but none of them proves data quality on its own. The biggest risk when choosing a sensor is not paying too much. It is investing in an instrument that looks right on paper but whose real-world performance in the field does not allow you to defend the results to a third party, an audit or a public health decision, or even to make decisions based on reasonably reliable data.
This article is not a feature list or a product ranking. It is a technical decision guide based on the sequence of criteria recommended by bodies such as the US Environmental Protection Agency (EPA) and the Air Quality Sensor Performance Evaluation Center (AQ-SPEC).
When choosing an air quality sensorMeasuring air quality is essential for improving human and environmental health. Changes in the natural composition of the air we breathe are common in ind...
Read more, it is worth looking at aspects such as:
- Project objective: what needs to be measured, what the data will be used for and which decisions it will have to support.
- Pollutants of interest: which gases, particles or other parameters the system needs to measure.
- Data quality: what level of precision, accuracy, repeatability and traceability the application requires.
- Independent evidence: which validations, certifications or external evaluations support the stated performance.
- Behaviour in real-world conditions: how the sensor responds to temperature, humidity, interferences and environmental variability.
- Calibration and drift: how measurement quality is maintained over time and what procedures exist to correct deviations.
- The complete system: not just the hardware, but also the data platform, communications, alerts, maintenance, support and remote management.
- Total cost of ownership: initial investment, consumables, calibrations, maintenance, communications, licences and service life.
The final choice should not be limited to the sensor as a device. It should assess the complete system and its ability to generate reliable data throughout the life of the project.
Air Quality Innovation in Just 1 Click
Stay informed about the air you breathe!
Subscribe to our newsletter to receive the latest updates on environmental monitoring technology, air quality studies, and more.
Which air quality sensor does your project need?
No sensor is ideal for every project. The right choice therefore does not start with a datasheet, but with a precise definition of what you want to achieve and under what conditions. An instrument designed for industrial monitoring is not necessarily the best option for academic research, just as a sensor optimised for particles does not necessarily perform as well when measuring gases.
The decision depends on at least eleven interrelated factors: the measurement objective, the pollutants to be monitored, the expected concentration range, the deployment environment, the project duration, the required data quality, the applicable regulation, available power, the type of communications required, planned maintenance and the total cost of ownership budget. This logic matches the recommendations of AQ-SPEC, which places project objectives and performance requirements ahead of product selection.

Choosing an air quality sensor means asking the right questions before you buy and telling the difference between a promising specification and demonstrable performance.
Define the monitoring objective first
The first criterion is not technical but strategic. The same technology is not necessarily suitable for different applications, because each one requires a different level of reliability, data frequency, resolution and traceability.
The most common objectives include scientific research, urban air quality monitoring, regulatory environmental compliance, industrial fenceline monitoring, leak detection, occupational exposure assessment, emissions control on construction sites, mining monitoring, odour management and response to environmental emergencies. Each of these scenarios in turn determines which pollutants matter, which measurement range is relevant and what level of uncertainty is acceptable.
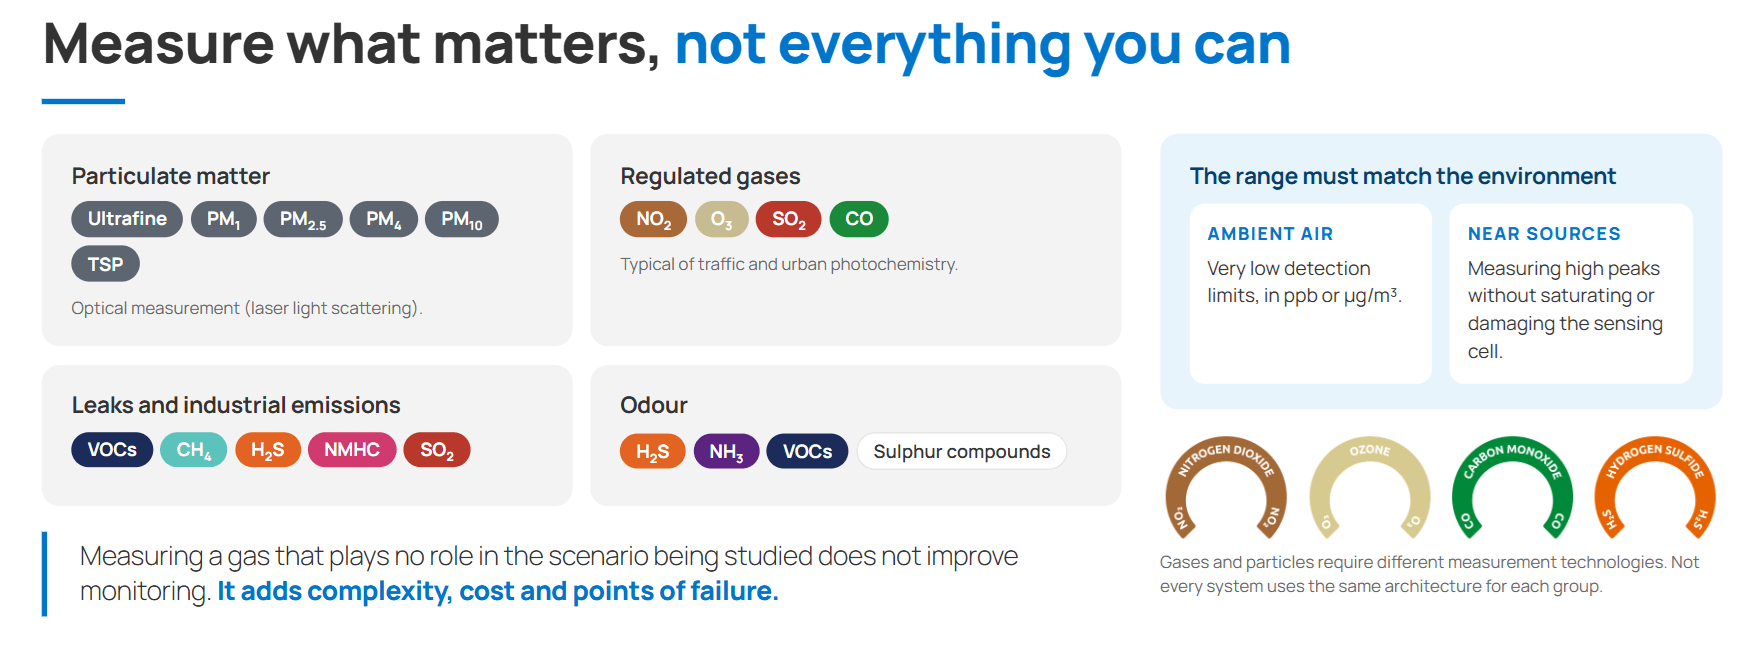
Measuring a gas that plays no role in the scenario under study does not improve monitoring. It increases complexity, cost and the number of potential points of failure.
Which pollutants do you need to measure?
Once the objective is defined, the selection of air pollutantsAir pollution caused by atmospheric contaminants is one of the most critical and complex environmental problems we face today, both because of its global r...
Read more becomes much more specific. The range of parameters that modern sensors can measure is wide and includes particulate matter, such as PM1 and smaller particles (of particular concern because they can reach the bloodstream), PM2.5, PM4 and PM10, as well as nitrogen dioxide (NO2)Nitrogen dioxide (NO2) is a harmful gas whose presence in the atmosphere is mainly due to the use of fossil fuels in combustion vehicles and industrial act...
Read more, nitric oxide (NO)Nitric oxide (NO) is one of the most important, and often underestimated, gases in the field of air quality and industrial emissions management. Colourless...
Read more, ground-level ozone (O3), carbon monoxide (CO)The carbon monoxide (CO) is an invisible gas (colorless and odorless) that, at the same time, is a silent killer because in just a few minutes it exhibits ...
Read more, sulphur dioxide (SO2)Sulphur dioxide (SO2) is a colourless gas with a pungent odour that causes an irritating sensation similar to shortness of breath. Its origin is anthropoge...
Read more, hydrogen sulphide (H2S)Hydrogen sulphide (H2S), also known as hydrosulphuric acid or sewer gas, is a gas unmistakable due to its characteristic rotten egg smell, noticeable even ...
Read more, ammonia (NH3)Invisible yet powerful: ammonia (NH3) is a colourless gas which, although naturally present in the atmosphere in small amounts, can become an unwelcome ene...
Read more, methane (CH4)Methane, known chemically as CH4, is a gas that is harmful to the atmosphere and to living beings because it has a high heat-trapping capacity. For this re...
Read more, volatile organic compounds (VOCs) and other gases specific to each sector.
It is important to avoid assuming that the more parameters you measure, the better. The right criterion is to measure the pollutants directly related to the emission source, the risk to be controlled and the project objective.
The biggest mistake when comparing air quality sensors
Most sensor comparisons start with the criteria that are easiest to measure on paper, such as price, battery life, number of parameters, network size, type of communications or design. Although all of these are useful and necessary for a final decision, none of them proves on its own the quality of the data the instrument will produce in the field.
If that data is going to support investment, regulatory compliance, public health measures or operational decisions, the question is not which specifications appear in print, but what guarantee there is that those specifications will be met at the actual location and for the duration of the project.
The biggest risk when choosing a sensor is not paying too much, but investing in equipment that looks good on paper but whose actual performance in the field fails to deliver the expected results.
Price and specifications are not the same as data quality
Two sensors that share the same underlying technology and measurement range on a datasheet can deliver very different results in practice. The difference rarely lies in the sensing element itself, but in everything around it: individual versus batch calibration, the temperature and humidity correction algorithms used, how cross-interference between gases is managed, quality control in manufacturing, and the design of the signal conditioning electronics and long-term stability.
A higher price does not automatically guarantee better data, just as a low price does not necessarily mean inadequate performance. What really makes the difference is independent evidence of how each technology performs against reference instruments, in real-world conditions and over extended periods.
How to check the accuracy of an air quality sensor
The only rigorous way to evaluate a sensor’s performance is through controlled comparison with reference instruments. The AQ-SPEC programme run by the South Coast AQMD evaluates each technology through co-location with FRM/FEM instruments (Federal Reference Method / Federal Equivalent Method) or equivalent reference technologies, and analyses metrics such as precision, accuracy, linearity, response to interferences, sensitivity to temperature and humidity, and variability between units of the same model.
Accuracy, precision and correlation do not mean the same thing
Reports often summarise a sensor’s performance in a single number, usually the coefficient of determination, R2. This simplification can be seriously misleading, because several different metrics describe different aspects of performance, and none of them is sufficient on its own.
- Accuracy describes how close the sensor reading is to the true value measured by the reference instrument.
- Precision describes the repeatability of the measurement at the same stable concentration.
- The R2 coefficient or correlation indicates what proportion of the variability in the reference data is captured by the sensor, but it does not detect systematic deviations.
- The slope and intercept complete the picture. For example, a slope close to 1 and an intercept close to 0 show that the sensor does not systematically overestimate or underestimate.
- The MAE (mean absolute error) expresses the average deviation in real physical units.
- Uncertainty combines all known sources of error into a confidence interval.
Variability between sensors of the same model
Variability between sensors of the same model deserves particular attention because it directly affects the reliability of dense networks. Two units of the same model made at different times or with different sensor batches will not necessarily give identical results. AQ-SPEC specifically includes intra-model variability among the metrics used to evaluate sensor technologies, precisely because a good average evaluation does not guarantee good consistency between individual units.
Certification and independent evaluation: what to ask for
A certification logo on a website should not be the only validation criterion. You need to establish what kind of framework is being cited, exactly which requirements it covers and which body has verified it.
Recognised certifications and standards
The most relevant frameworks in Europe and internationally include the technical specification CEN/TS 17660, which sets out requirements and test methods for sensors measuring ambient air quality; the US EPA evaluation protocols; and the UK MCERTS scheme for environmental monitoring equipment.
Outside Europe, a notable example is South Korea’s Grade 1 for PM2.5, awarded to Kunak AIR Pro following evaluation by KOTITI Testing & Research Institute. This is the performance certification for simple fine dust measuring devices, number KOTITI-2025-14, registered on 29 December 2025.
There are also methods and data quality objectives that apply under each country’s legislation, as well as other specific national certifications.
The technical specifications CEN/TS 17660-1:2021 and CEN/TS 17660-2:2024 classify sensor performance in line with the Data Quality Objectives (DQO) defined in Directive 2008/50/EC. Sensors that meet the DQO required for indicative measurements belong to Class 1, while Class 2 sensors meet the DQO for objective estimation. Chacón-Mateos, M., García-Salamero, H., Laquai, B. and Vogt, U. (2025).
It is worth making clear, however, that a regulation is not necessarily a certification. Directive (EU) 2024/2881, for example, sets out a regulatory framework that Member States must comply with, but it is not in itself a certification that a manufacturer can obtain for a specific product.
Evaluations by independent bodies
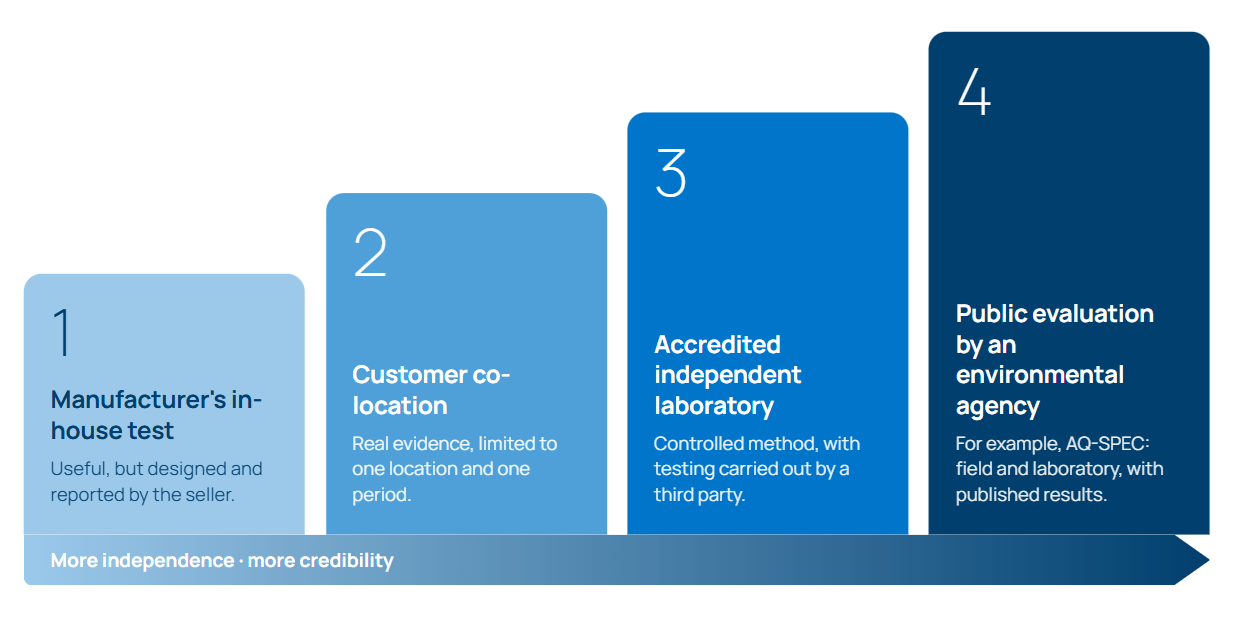
Not all performance tests carry the same evidential weight. At least four levels can be distinguished.
- In-house testing carried out by the manufacturer.
- Co-location carried out by the customer at their own site.
- Evaluation at an accredited independent laboratory.
- Public evaluation carried out by an official environmental agency.
Each of these levels adds a greater degree of independence and therefore of credibility.
Programmes such as AQ-SPEC carry out public field and laboratory evaluations precisely to characterise the real-world performance of commercial sensors, without relying on the results each manufacturer chooses to publish.
Look for full reports, not just logos
When a manufacturer cites an evaluation or certification, it is advisable to request and review the full report. The key elements it should include are:
- The methodology used.
- Detailed numerical results.
- The pollutant or pollutants evaluated.
- The concentration range covered.
- The test duration.
- The reference station used for comparison.
- The environmental conditions during testing.
- The number of units evaluated.
- And, most importantly, the limitations identified.
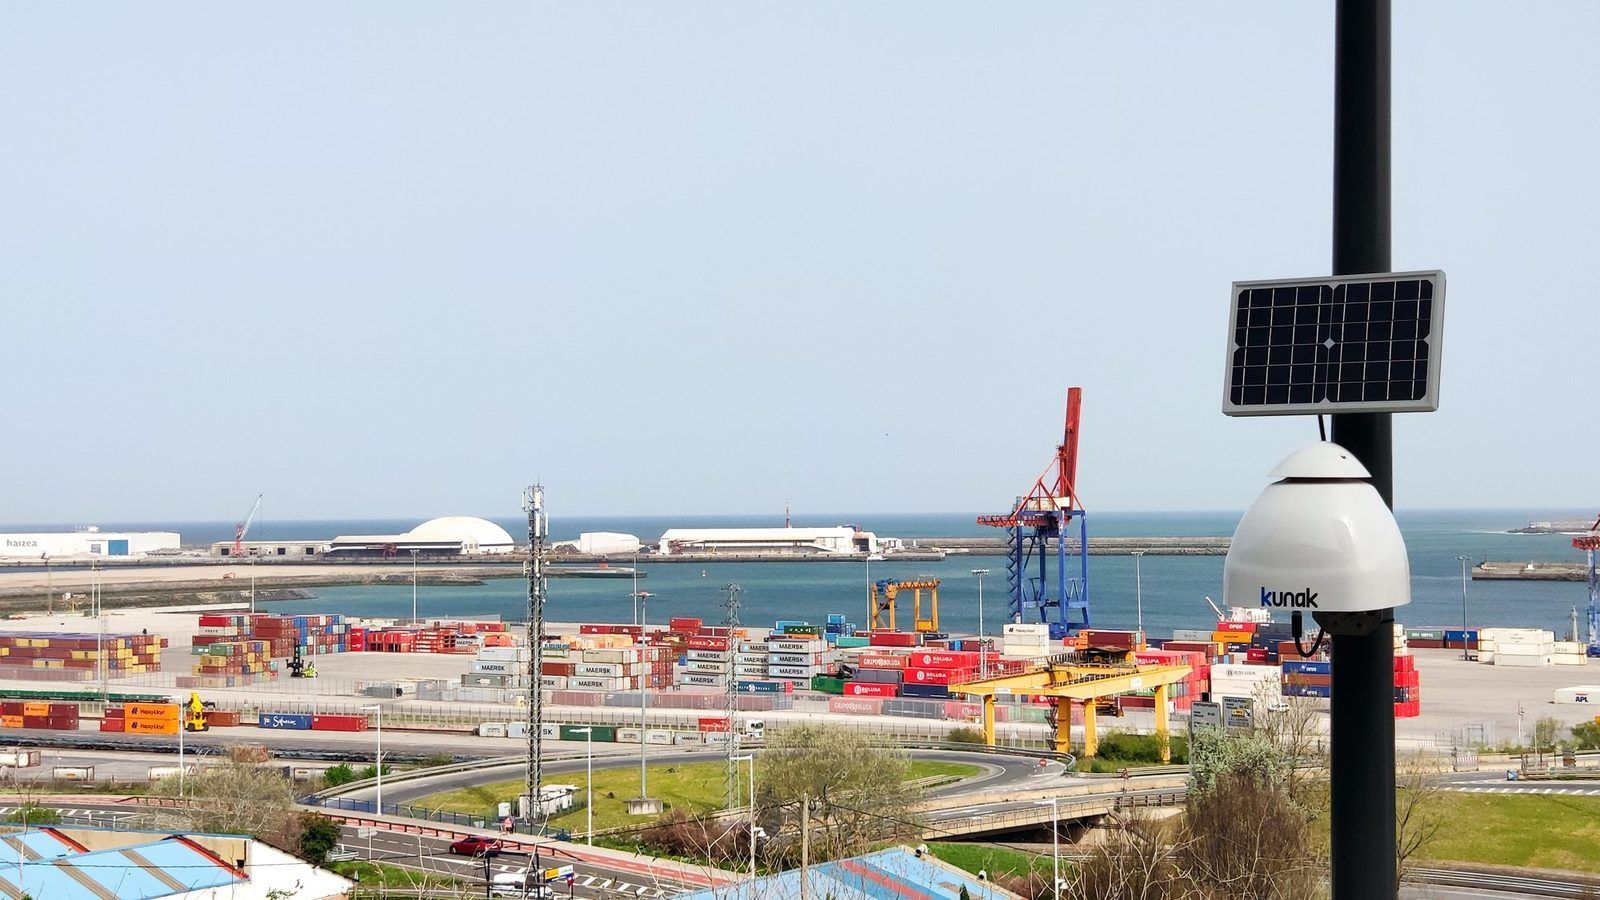
Many projects are deployed in settings where there is no local reference station for prior co-location and adjustment.
How the sensor performs in real-world conditions
Laboratory specifications describe ideal behaviour, but real-world performance depends on how the system responds to changing environmental conditions.
Temperature, humidity and cross-interference
Electrochemical and optical sensors can change their response when temperature, relative humidity, the measured concentration or the overall climate vary. In addition, the presence of interfering pollutants can generate cross-signals that distort the reading for a specific gas. AQ-SPEC explicitly evaluates these effects both in a laboratory chamber and in field deployments, to characterise how well each technology maintains its performance outside optimal conditions.
The EPA protocols for PM2.5 sensors include laboratory tests at 40% and 85% relative humidity and at temperatures of 20 °C and 40 °C, as well as drift and high-concentration tests, because the response of these instruments can vary with environmental conditions. US EPA (2021), EPA/600/R-20/280.
The challenge of measuring at an unfamiliar location
Many projects are deployed in settings where there is no local reference station for prior co-location and adjustment. This is the case in new urban areas, mines, industrial plants, ports, landfills, construction sites and remote locations. The relevant question should not only be whether the instrument works well after a specific co-location, but what performance it retains when deployed in conditions it has not been specifically adjusted for.
Generalisation versus site-dependent correction
There is a fundamental technical difference between two approaches. A system that produces independent, transferable measurements maintains its performance without relying on local adjustments or external data. A system whose performance depends heavily on site-specific corrections may deliver good results at a calibrated point but lose validity when moved. This distinction is especially relevant for large networks or deployments in environments with no prior reference, and is directly related to concepts such as independent sensor measurement, processing transparency and near-reference performance.
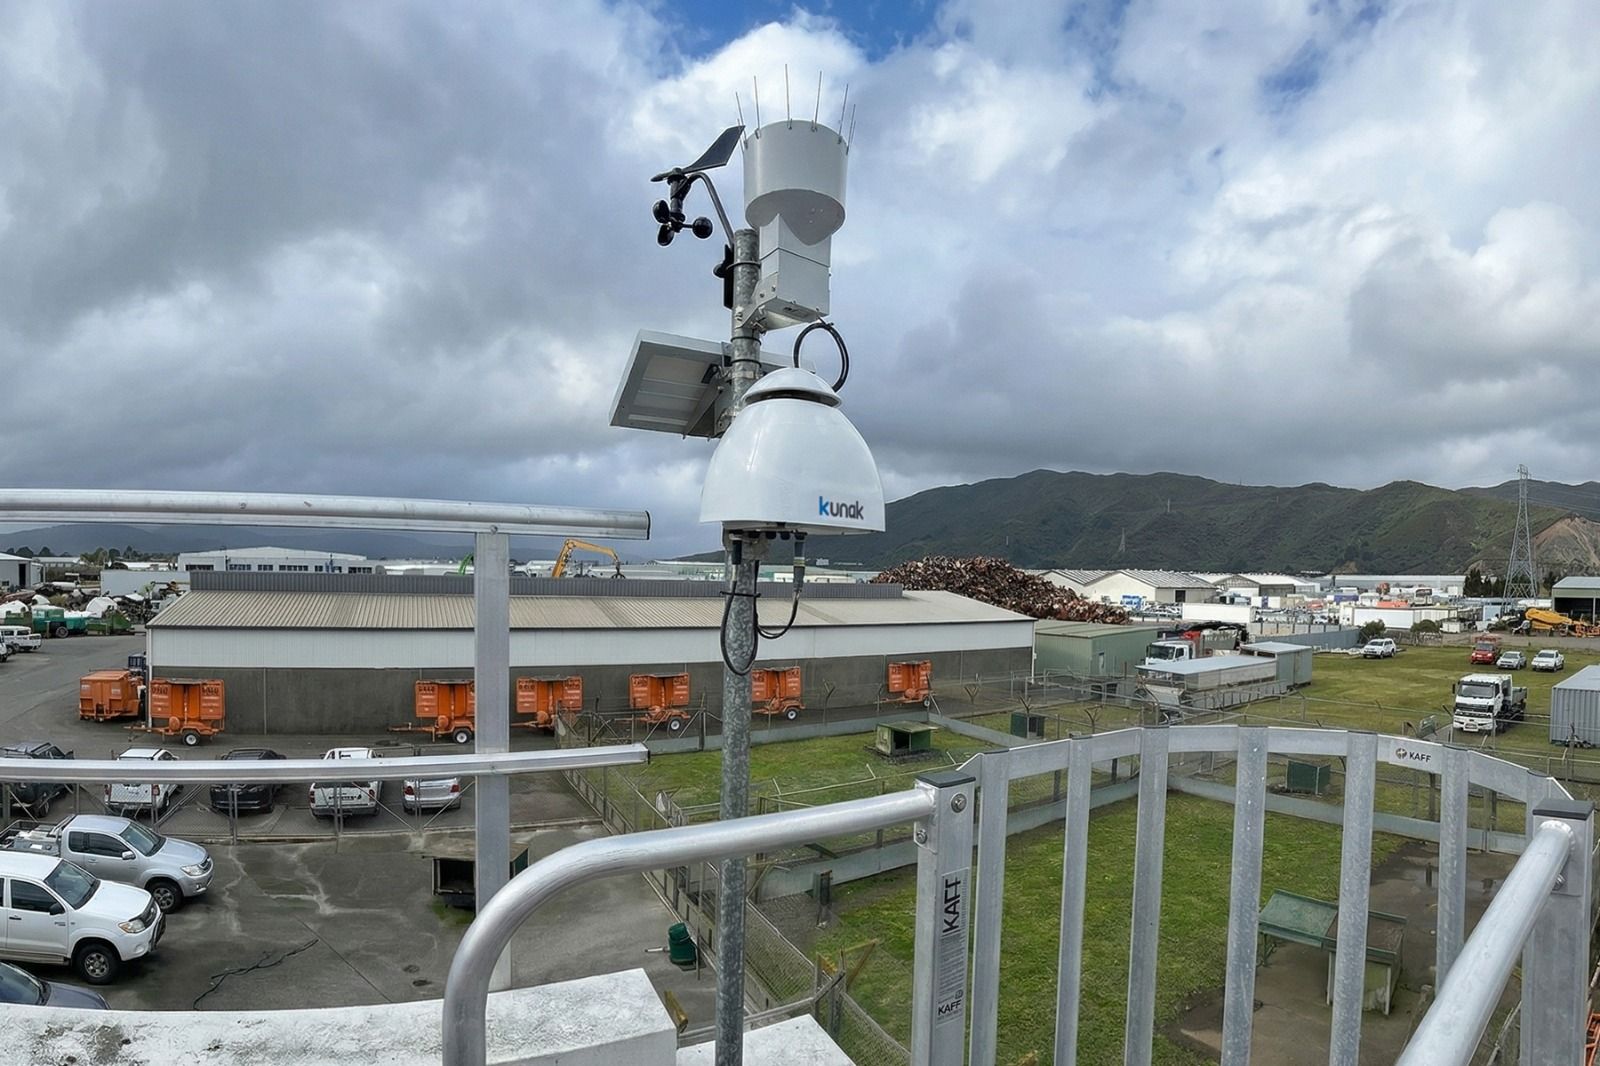
The value of near-reference monitoring systems lies in the calibration of their near-reference sensors, which keeps them closely linked to international standards.
Calibration, drift and long-term data quality
No sensor maintains its initial performance indefinitely. Data quality over time depends both on the design of the instrument and on the manufacturer’s ability to manage the inevitable, intrinsic effects on the sensor, such as ageing.
All sensors drift over time
Drift is a natural phenomenon in any measurement technology. It can be caused by ageing of the sensing element, zero drift, changes in sensitivity, contamination of the measuring chamber or prolonged exposure to extreme environmental conditions. Ignoring this effect does not make the problem go away; it simply turns a known quantity into unmanaged uncertainty.
How the manufacturer should manage drift
To deal with the natural drift of any measurement technology, any sensor offer should be able to answer yes to the following questions:
- Is there individual factory calibration?
- Can it be recalibrated?
- Is there zero and span adjustment?
- Can calibration gas be used?
- Is there automatic correction?
- How is degradation detected?
- Is there a historical audit trail?
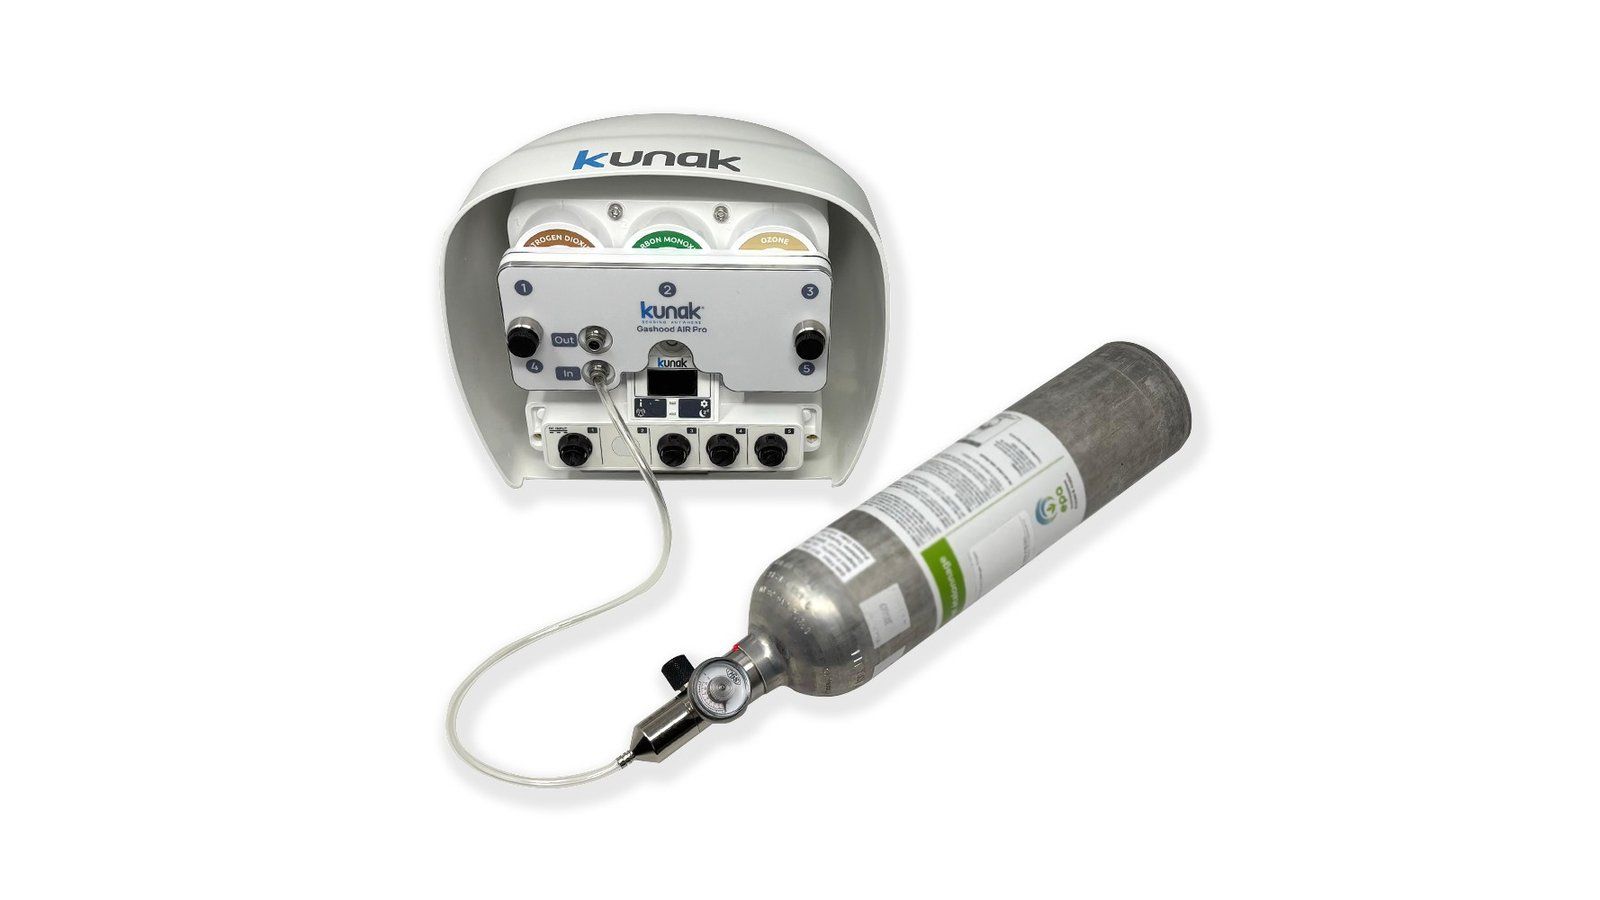
Kunak AIR Pro fitted with a calibration hood connected to a calibration gas cylinder to calibrate the sensor in the field.
Co-location, field calibration and calibration gas
Not all calibration strategies offer the same level of assurance. Co-location with a reference station is useful for validating performance at a specific location. Calibration with traceable calibration gas, on the other hand, makes it possible to verify sensor performance over time regardless of location and to establish a genuine metrological reference. The two are complementary, not interchangeable.
Low-cost versus professional and near-reference sensors
The monitoring market is divided into different levels of use depending on what the data is for. Comparing a basic low-cost device directly with a professional one makes no technical sense unless you first define what level of rigour and reliability the project requires. To frame the choice correctly, the available technologies can be grouped into three main levels of use: basic sensors, professional sensors and near-reference systems. It should be understood that near-reference is not a universal regulatory category. Rather, it is a concept used to describe a level of performance very close to that of reference instrumentation, provided that this performance is strictly backed by technical evidence.
| Criterion | Basic sensor | Professional sensor | Near-reference |
|---|---|---|---|
| Indicative use | Yes | Yes | Yes |
| Traceable calibration | Limited | Variable | High |
| Independent evaluation | Variable | Common | Recommended |
| Drift control | Limited | Variable | Advanced |
| Multi-unit consistency | Variable | Medium/high | High |
| Professional applications | Limited | Yes | Yes |
| Use for critical decisions | Limited | Depending on evidence | Depending on DQOs and project |
While a basic sensor is perfectly valid for obtaining an indicative trend, projects that need to defend their results in audits, against regulations or to communities require the technological step up to professional or near-reference instruments.
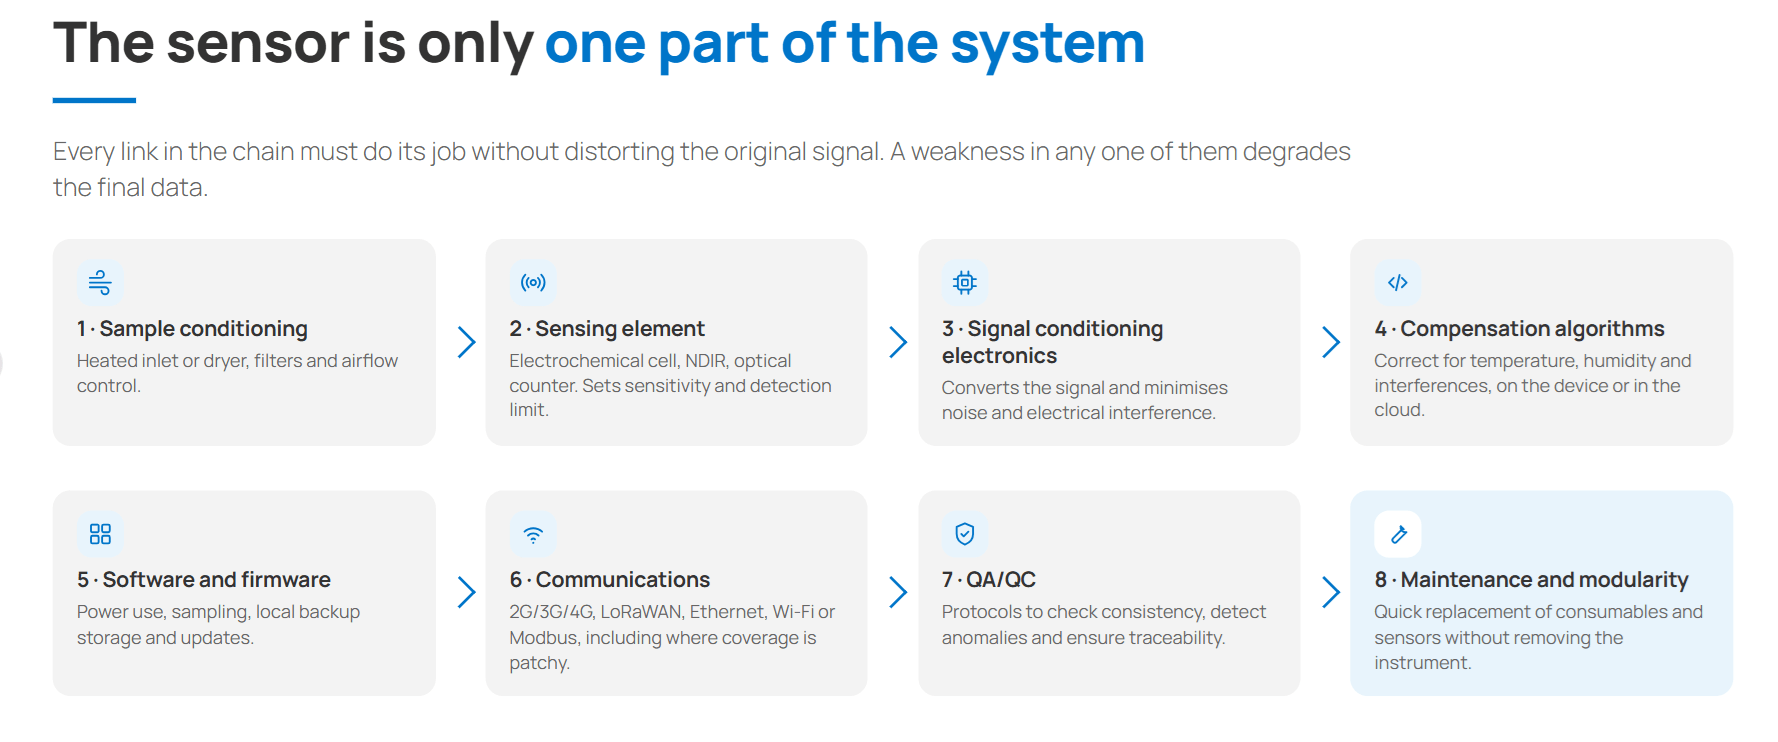
The final choice should not be limited to the sensor as a device, but should take into account the entire system and its ability to generate reliable data throughout the project’s lifecycle.
Hardware, software and maintenance: evaluate the complete system
A common mistake when buying air quality monitoringControlling air quality is an essential task in order to enjoy optimal environmental conditions for healthy human development and to keep the environment i...
Read more technology is to focus solely on the sensor datasheet. In professional settings, however, a sensor on its own does not guarantee valid or operational measurements in the long term. Data quality and the project’s return on investment depend on the robustness of the complete system, from the physics of the measurement to the digital platform and the associated ongoing operating costs.
The sensor is only one part of the system
For a measurement to be accurate, stable and useful, you need an integrated design in which each technical component of the monitoring system does its job without distorting the original signal:
- Sensing element: the core that interacts with the pollutant or environmental variable (electrochemical cells, NDIR, optical particle counters, etc.). It defines the base sensitivity and the detection limit.
- Signal conditioning electronics: converts the sensor’s analogue signal into processable digital signals, minimising electrical noiseImagine waking up every morning at 5:00 a.m. to the relentless roar of a motorway just metres from your window. Experiencing such high-intensity noise is n...
Read more and magnetic interference and ensuring stable readings. - Sample conditioning: essential to protect the measuring cell and avoid false readings. It includes systems to mitigate the effect of relative humidity (heated inlet lines or dryers), particle filters to protect gas sensors and control of the sampled airflow.
- Compensation algorithms: advanced algorithms, on the device or in the cloud, that correct in real time for cross-drift caused by temperature, humidity or interference from other gases in the atmosphere.
- Communications: data transmission modules (2G/3G/4G, LoRaWAN, Ethernet, Wi-Fi or Modbus) that ensure information is sent continuously, even in areas with patchy coverage or in adverse conditions.
- Software and firmware: internal code that manages power consumption, sampling frequency, local backup storage (data logging) and remote security updates.
- Quality assurance and quality control (QA/QC): automated, systematic protocols to check data consistency, detect physical anomalies and ensure the operational traceability of every measurement.
- Maintenance and modularity: mechanical design that makes installation easy and allows quick replacement of consumables or plug-and-play replacement of sensors, without having to remove the whole instrument or interrupt service for long periods.
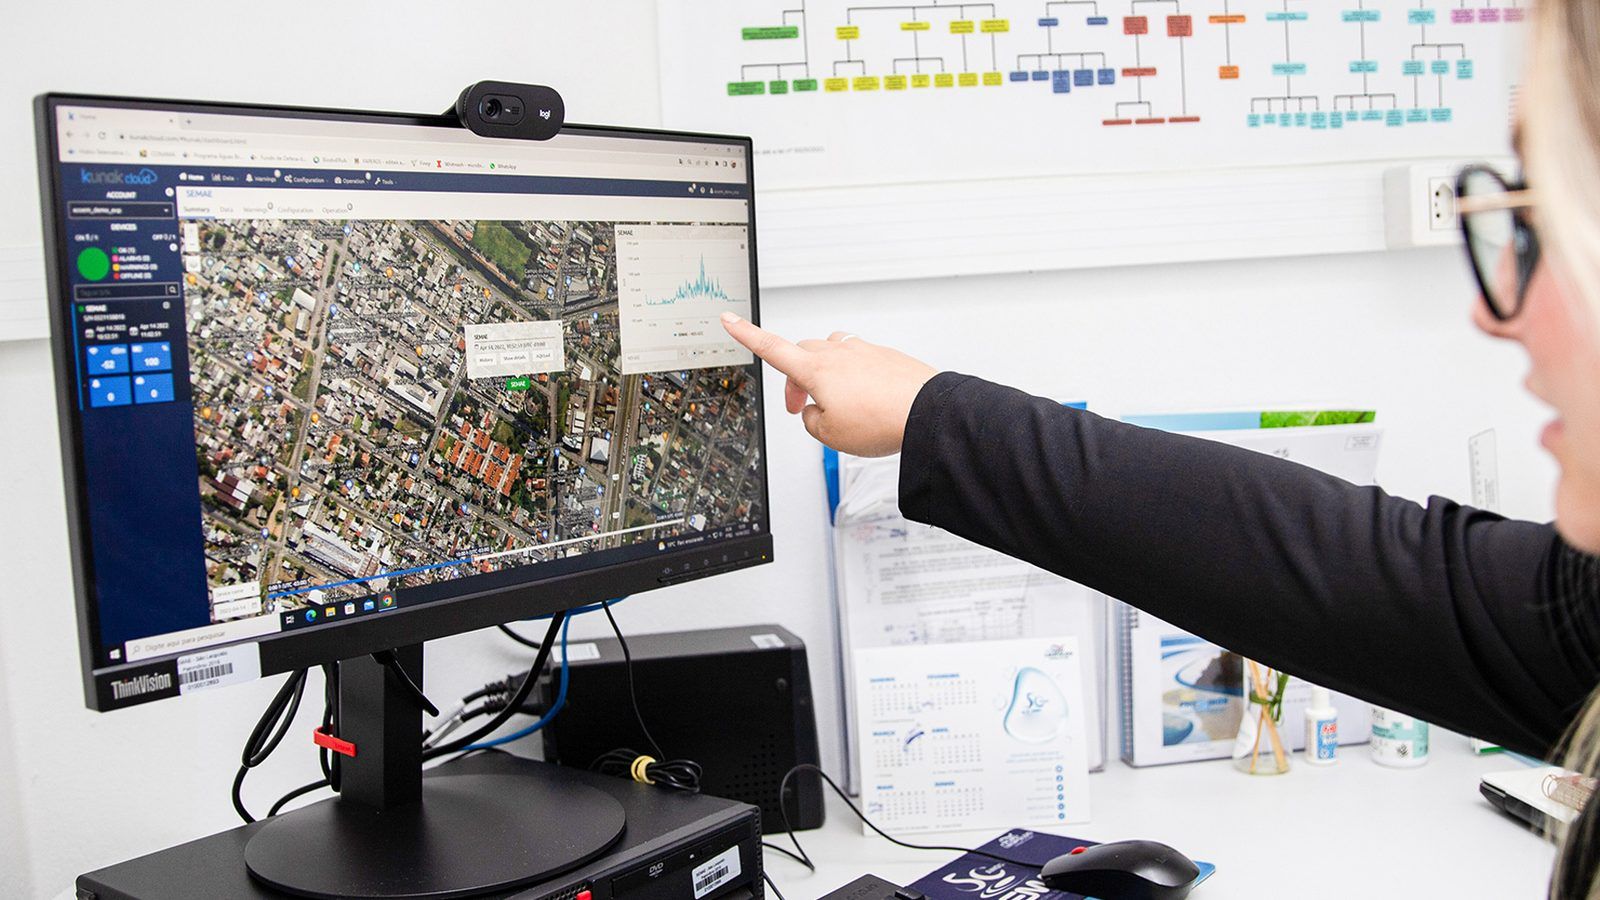
A good sensor with poor software or inadequate maintenance still produces poor data.
Data platform, alerts and remote diagnostics
The software infrastructure is the link between data capture and decision-making. Exceptional hardware is useless if the information is inaccessible, disorganised or unvalidated. When evaluating the digital layer, it is essential to check for the following capabilities:
- Real-time visualisation and network map: instant access to current levels through interactive dashboards, georeferenced maps and intuitive air quality indicators.
- Historical analysis and trends: built-in tools to view time series, compare periods, calculate averages (hourly, daily, annual) and identify pollution patterns.
- Automatic alert management: real-time notifications (by email, SMS or webhook) when regulatory thresholds are exceeded, when abnormal peaks occur or when equipment fails.
- API integration: availability of a REST API or data subscription services to feed readings directly into the customer’s platforms (BMS, geographic information systems, public web portals or smart city platforms).
- Flexible data export: the option to download records in standard formats (CSV, JSON, Excel) with all associated metadata for external analysis or audits.
- Data validation layer: tools to automatically filter or flag questionable data (for example, during maintenance or power or communications outages) before it is published or used in official calculations.
- Centralised device management: a single control panel to manage entire sensor networks, add and remove devices and configure network parameters remotely.
- Remote diagnostics and data integration: the ability to monitor the instrument’s status in real time (voltage, power consumption, internal temperature, network coverage, airflow status) to resolve software issues without sending technicians to site, and to integrate data from third parties or other sources, such as official networks or reference stations, for a richer, contextualised analysis.
Total cost of ownership
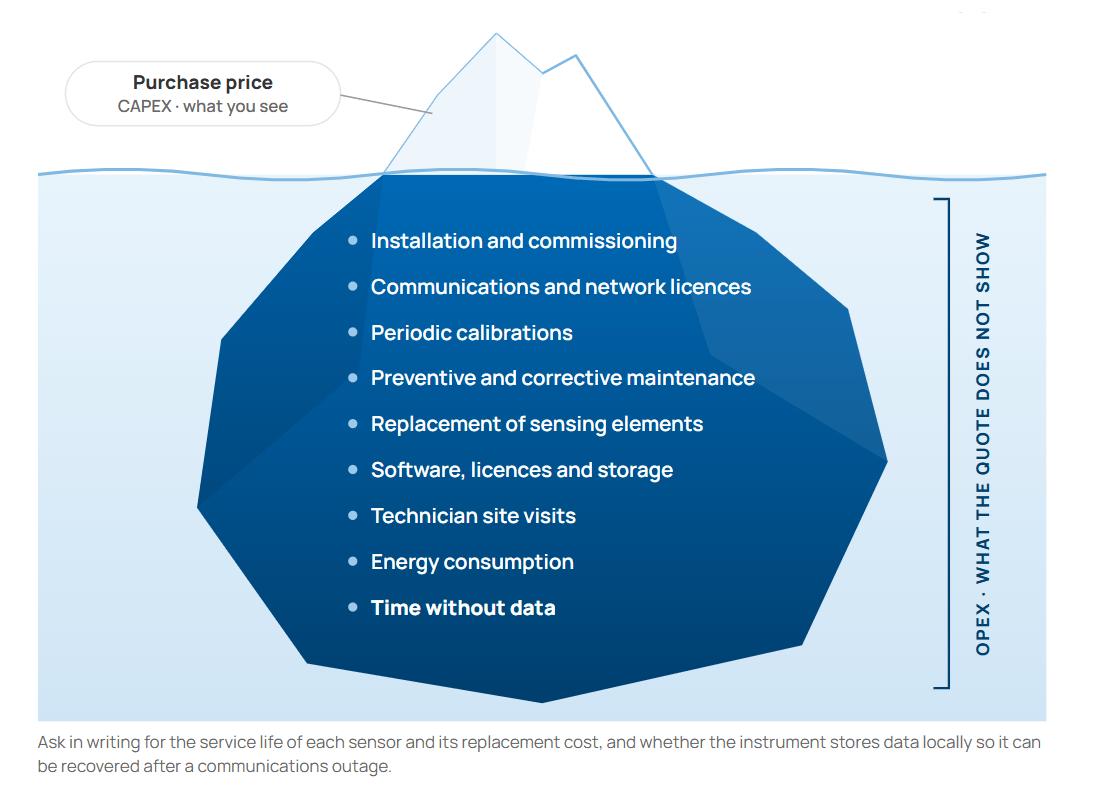
The purchase price of the instrument (CAPEX) accounts for only a fraction of the real cost over its service life. Assessing a project on the initial invoice alone tends to lead to significant budget overruns in the medium and long term. To calculate the total cost of ownership (TCO), which adds up the initial investment (CAPEX) and operating costs (OPEX), the following items need to be carefully accounted for:
Total cost = CAPEX (purchase) + deployment + ongoing operation + maintenance + downtime
- Installation and commissioning: field staff with the necessary equipment (cranes, aerial work platforms) for deployment, mounting hardware costs, mains connection or solar systems, fixing to street furniture or towers, and initial set-up time.
- Communications: charges for M2M SIM connectivity, network licences or maintenance of the transmission infrastructure.
- Periodic calibrations: costs of field recalibration, calibration gas cylinders, laboratory testing or co-located calibration with reference stations.
- Preventive and corrective maintenance: regular replacement of consumables (air filters, tubing, pumps) and repair of faults.
- Replacement of sensing elements: measuring cells (especially electrochemical ones) degrade naturally. Their service life varies with technology and manufacturer, so you need to know it and plan for the frequency and cost of replacement.
- Software subscriptions and licences: cloud platform licences, historical data storage costs, updates and ongoing technical support.
- Technician site visits: staff hours and travel needed to resolve physical issues at the measurement point, such as repairs, maintenance or replacement of expired components. Good remote diagnostics cuts this item dramatically.
- Energy consumption: in isolated or solar-powered locations, the instrument’s consumption determines the size and cost of the solar panel and battery system required.
- Time without data (downtime cost): the financial and operational impact of losing data series for days or weeks due to system failures, which can invalidate entire studies or breach service contracts. It is also worth assessing whether mitigation mechanisms exist, such as local storage on the device and automatic backups that allow data to be recovered once connectivity is restored.
Reliability in data quality is exactly what a monitoring project needs to achieve.
Questions to ask before buying an air quality sensor
In line with the methodological approach of international bodies such as the US EPA (in its guidance on selecting and planning air quality projects), buying a measuring instrument should not start with comparing brands or prices, but with defining the project’s operational objectives.
To make a rigorous choice and avoid wasted investment, you can use this list of essential requirements before making a purchasing decision:
Which pollutants do I need to measure?
There is no universal sensor for everything. You need to specify which group or groups of pollutants are directly related to the project objective:
- Particulate matter: ultrafine particlesAt first glance, the air around us may seem clean, but beware, it hides an almost imperceptible danger: ultrafine particles (UFP). With a size so small the...
Read more, PM1, PM2.5, PM4 and PM10. - Regulated and criteria gases: NO2, O3, SO2 and CO.
- Gases associated with leaks and industrial emissions: VOCs, CH4, H2S, NMHC and SO2.
- Odour-related compounds: H2S, NH3, VOCs and sulphur compounds, among others.
The internal technology needed to measure gases (such as electrochemical cells) is completely different from that used for particulate matter (laser light scattering).
What concentrations do I expect to find?
The measurement range must match the deployment environment. In ambient air in urban or rural areas, detection limits need to be very low (at the level of parts per billion (ppb) or μg/m3). If the instrument is to be installed near industrial stacks or in areas with heavy traffic, it must be able to measure high concentrations without saturating or damaging the sensing cell.
What data quality does my application need?
Determining the project’s Data Quality Objectives (DQO) is the key. Whether you are looking for indicative monitoring for community awareness, an early warning system or data to validate dispersion models and environmental reports, the greater the responsibility the application carries, the higher the level of precision, accuracy and repeatability you should demand from the device.
Is there an independent evaluation?
Do not rely solely on the datasheets published by the manufacturer. It is advisable to find out whether the sensors have undergone field testing or evaluation by recognised independent bodies (such as the EPA through its Air Sensor Toolbox, the AQ-SPEC programme of the South Coast AQMD or equivalent European certifications).
Can I see the full results of those evaluations?
You should insist on seeing the full technical report, not just an isolated precision figure or a correlation coefficient (R2) taken out of context. It is crucial to check under what weather conditions, over what concentration range and for how long the independent tests were carried out.
How does the sensor respond to temperature and humidity?
Environmental variations are the main enemy of low-cost and professional sensors alike. You need to check whether the hardware includes physical sample conditioning (such as heated inlet lines to stop humidity condensing or inflating particle readings) and whether the firmware applies real-time temperature compensation algorithms.
What known interferences does it have?
Many gas sensors suffer from cross-sensitivity. For example, an NO2 sensor may respond to the presence of O3, or a VOC sensor may respond to water vapour or alcohols. For this reason, you should ask the manufacturer for the list of known cross-interferents and how the system mitigates them.
How does it control drift over time?
All sensing cells degrade and their baseline signal drifts (zero drift and span drift) as they age. You should therefore ask whether the instrument includes self-calibration mechanisms, software drift correction or whether it requires periodic manual intervention to reset the zero.
How and how often is it calibrated?
It is advisable to find out what calibration options the technology offers. It may require the instrument to be sent back to the factory, be calibrated in the field, or allow adjustment by co-locating the sensor next to a reference station for a few days.
How consistent are different units with each other (intra-model variability)?
If you plan to deploy a network of several sensors, you need to be sure that two instruments installed at the same point measure exactly the same. Ask for data on intra-model variability between different units from the same production batch to avoid inconsistencies across the network.
What technical maintenance does it need and what is the sensor’s service life?
Asking how often consumables need to be changed (inlet filters, tubing, pumps) and what the estimated service life of the sensing elements is (it varies with technology and manufacturer, so it is best to get it in writing) will avoid budget surprises in the future.
Will I be able to defend this data to a third party?
If the results are going to be presented to a public authority, in a sustainability audit, in court or to neighbours and affected communities, the system must offer calibration traceability, tamper-proof records and a validation methodology backed by technical evidence. If the answer is no, the initial saving on the sensor will have been for nothing.
How to choose the right sensor for each application
The success of an environmental monitoring project lies in deploying the right technology for the specific challenge it faces. The needs of a municipal network are radically different from the operational demands of an open-pit mine or a chemical plant. The technical factors to prioritise in each sector are set out below.
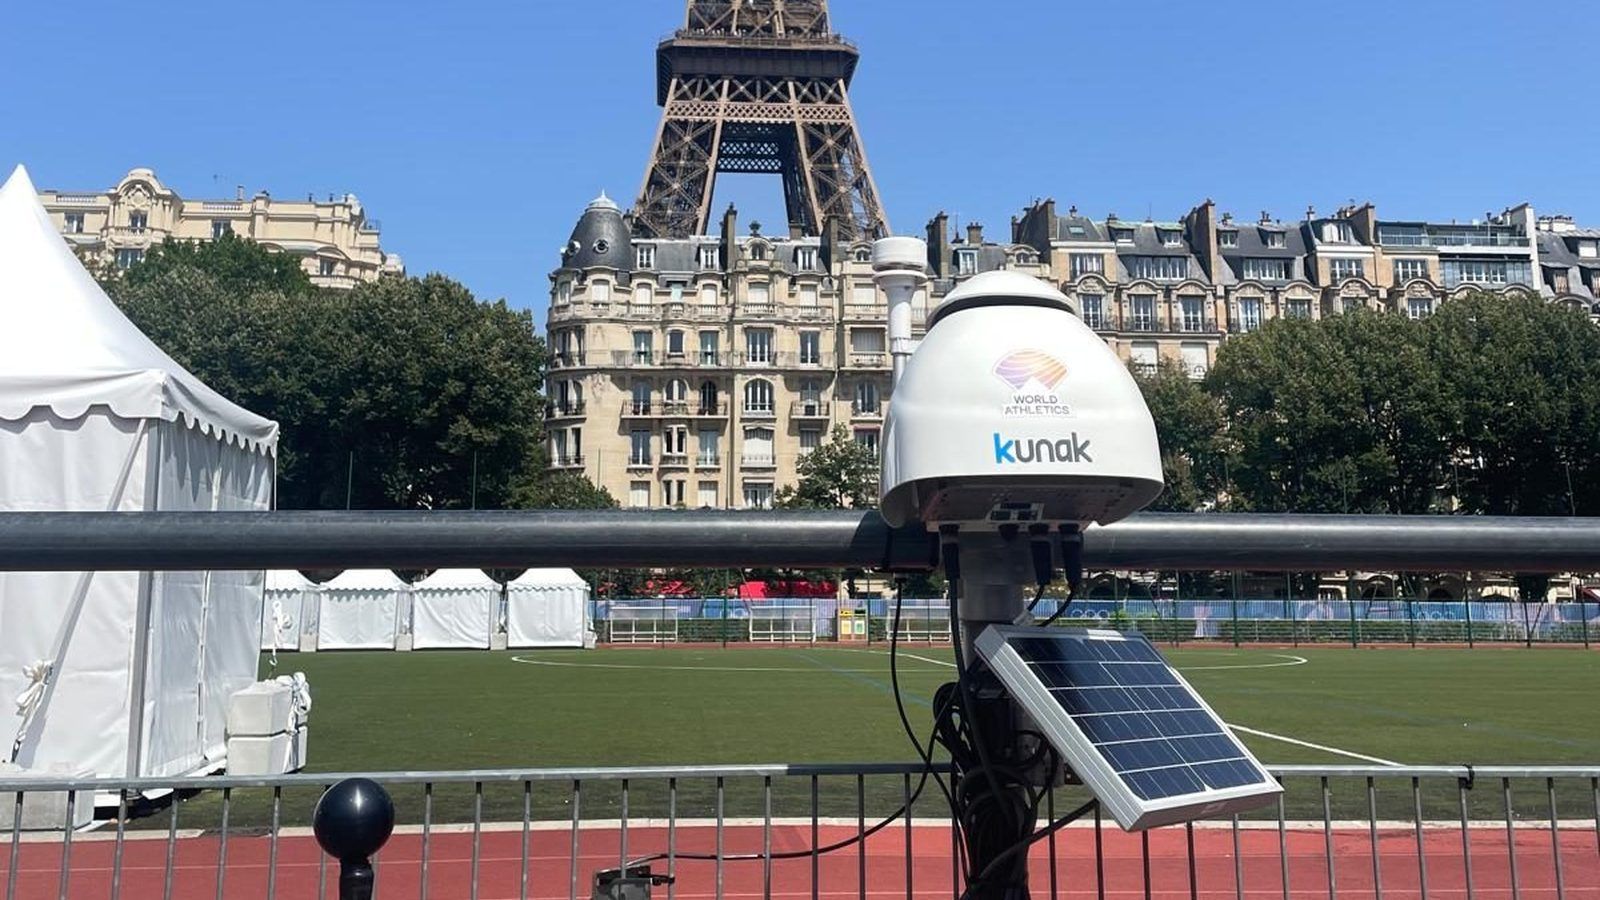
No sensor is better than all the others. There is one that is best for each project.
Sensors for urban air quality
Managing low emission zones (LEZ), controlling traffic and protecting school environments all require capturing street-by-street variability in pollution.
- Key parameters: it is essential to measure the pollutants typical of traffic and urban photochemistry, in particular nitrogen dioxide (NO2), ozone (O3) and particulate matter (PM10 and PM2.5).
- Dense networks and spatial resolution: to avoid blind spots, the system must be economically scalable, making it possible to deploy multiple stations (dense networks) that provide a high-resolution spatial map.
- Interoperability: the instruments must integrate easily via API with local authority management platforms, public information dashboards or smart city systems.
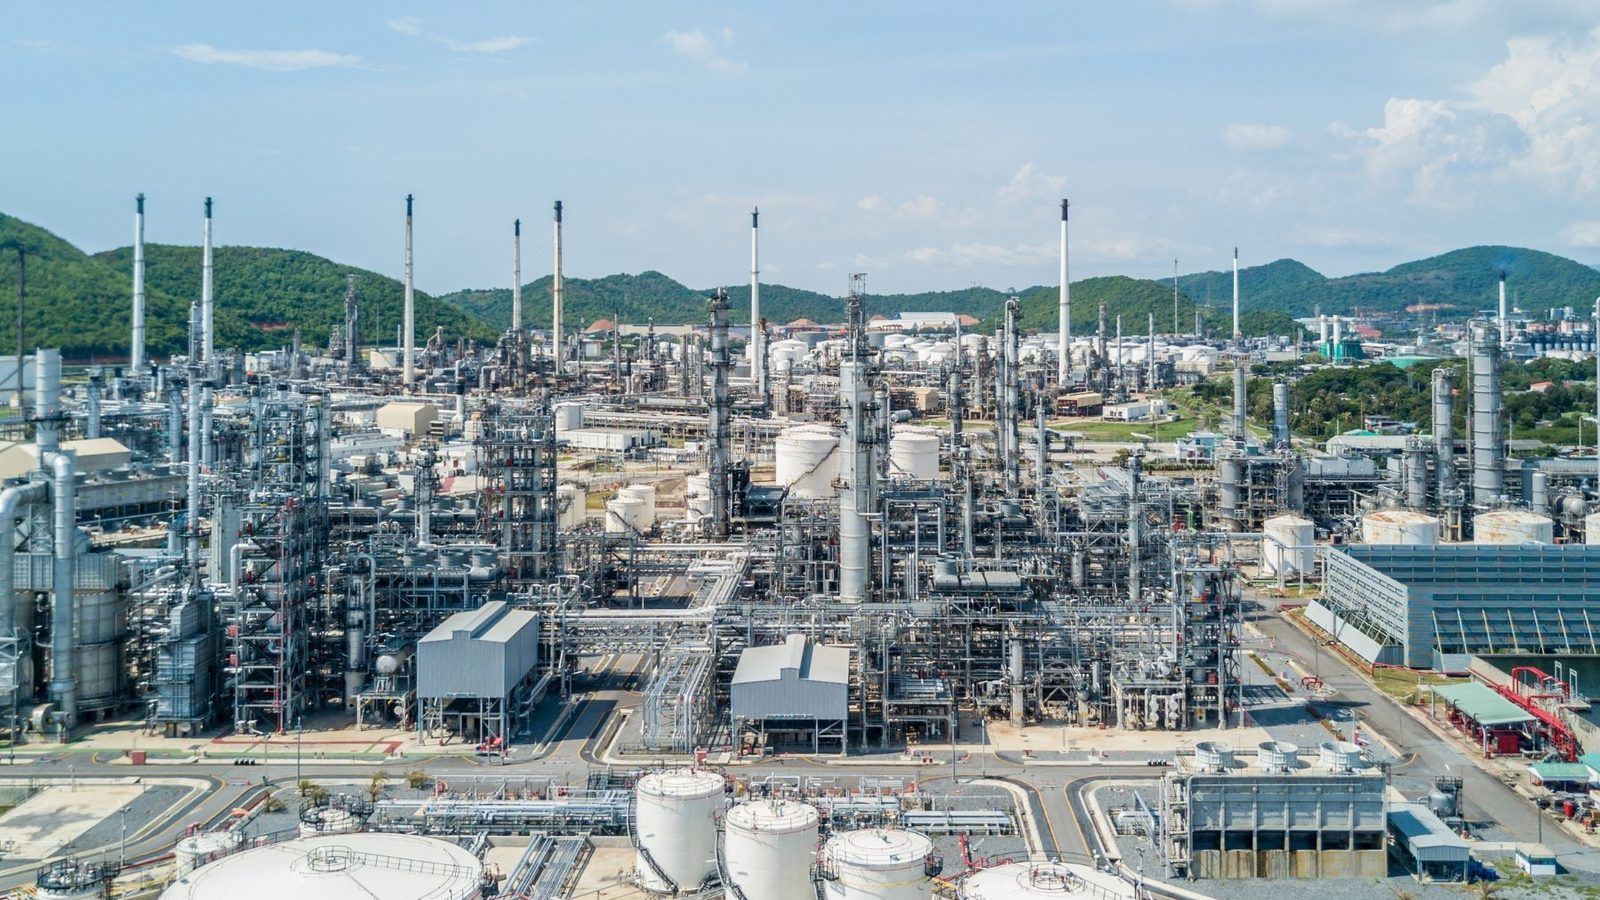
The monitoring market is divided into different levels of use depending on what the data is for.
Sensors for industry and emissions
In industrial settings, the main objective is to control the impact of operations on neighbouring communities, ensure regulatory compliance and react quickly to leaks or abnormal processes.
- Perimeter or fenceline monitoringFenceline monitoring is the continuous measurement of air quality along the boundary of an industrial facility using environmental monitoring technologies ...
Read more: deploying instruments around the site perimeter makes it possible to continuously monitor the property boundary and define the company’s responsibility. - Measurement ranges and specific pollutants: it is essential to choose sensors calibrated for the specific pollutant the plant emits (SO2, HF, HCl, etc.) and to make sure the hardware can handle high-concentration peaks without saturating.
- Meteorology and episode detection: integrating anemometers and weather sensors is vital to cross-reference wind direction with concentrations and trace the exact source of a pollution episode.
- Early warnings: the system must provide automated notifications that instantly alert plant operators when safety thresholds are exceeded.
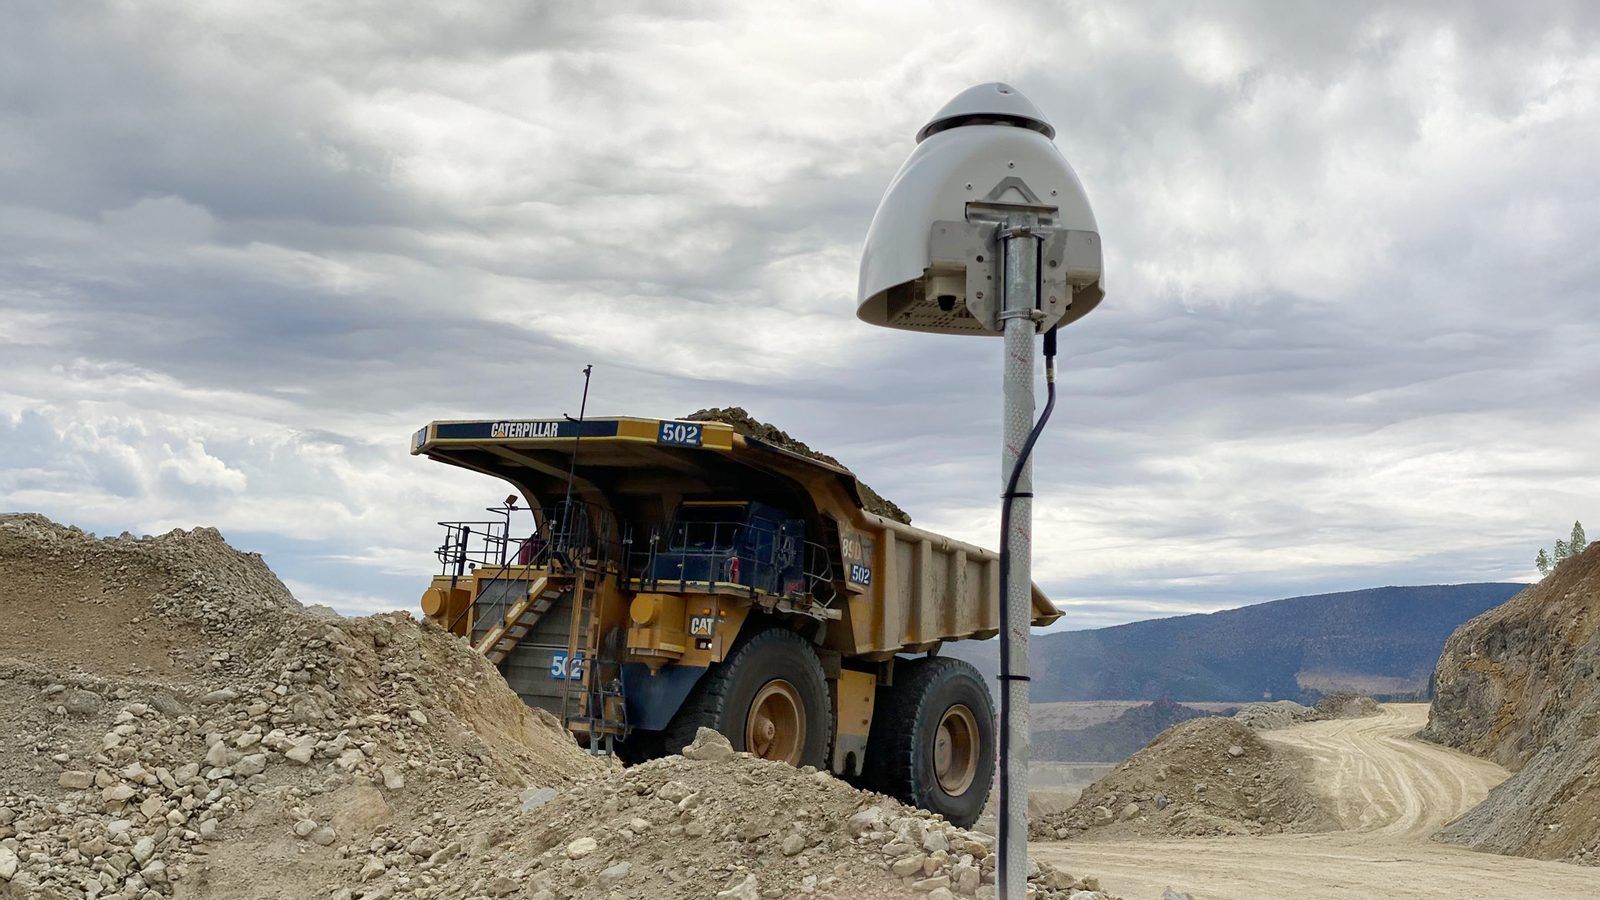
Mining projects, like construction and other dust-generating activities, need to defend their results in audits, against regulations or to communities, so they require the step up to professional or near-reference sensors.
Sensors for construction, mining and dust
Extractive activities, bulk materials handling, demolition and large infrastructure projects face extreme operating conditions and massive dust generation.
- Particulate matter fractions: measurement should prioritise PM10, PM2.5 and, where regulations or nuisance require it, total suspended particles (TSP).
- Robustness: the hardware must be designed with high-protection industrial enclosures (IP65) able to withstand vibration, impacts, extreme temperatures and constant exposure to dust.
- Autonomy: given the lack of infrastructure at mines or temporary construction sites, the instruments must be able to operate autonomously using solar panels and built-in batteries.
- Alerts for mitigation: the ability to send immediate warnings to trigger corrective measures, such as water cannons or a temporary halt to work.
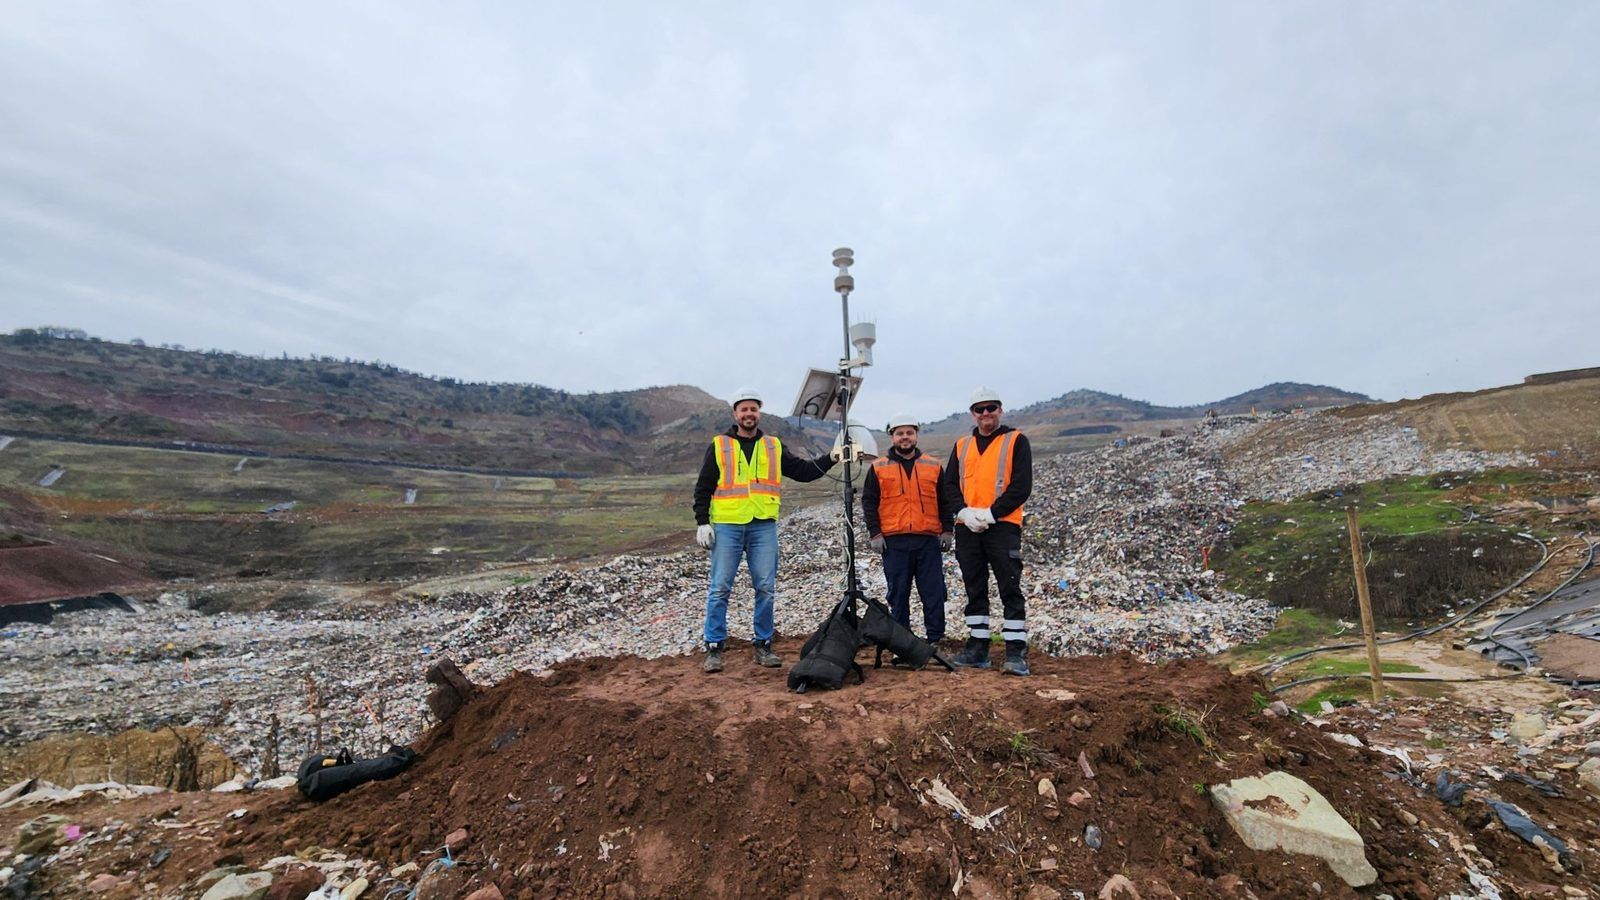
In professional settings such as odour-generating landfills, a sensor on its own does not guarantee valid or operational measurements in the long term. Data quality and the project’s return on investment depend on the robustness of the complete system.
Sensors for odour and specific gases
Odour nuisance from wastewater treatment plants (WWTPs), landfills, composting plants and livestock farms is one of the main causes of public complaints.
- Precursor gases: since the human sense of smell is subjective, instrumental monitoring is based on measuring the gases responsible for the nuisance at very low concentrations (ppb levels), mainly hydrogen sulphide (H2S), ammonia (NH3) and volatile organic compounds (VOCs).
- Spatial distribution: sensors need to be placed at the emission source, on the plant perimeter and in the receiving residential areas in order to correlate emissions with their real impact.
- Modelling and meteorology: as in industry, combining accurate wind speed and direction data is essential to track the odour plume, predict its dispersion and demonstrate empirically to the community where emissions come from.
How Kunak evaluates the quality of its sensors
In response to the rigorous selection criteria demanded by the environmental sector, Kunak bases the validity of its data on scientific evidence, testing under international standards and strict quality control at every stage of production.
Individual calibration and traceability from the factory
Every smart cartridge undergoes individual calibration and validation in the laboratory using gas standards traceable to international standards (such as ISO 6141 and NIST). Calibration data, manufacturing date and pollutant type are stored in the cartridge’s own internal memory, ensuring full traceability throughout its service life.
Compliance with regulatory and methodological frameworks
It is essential to distinguish between regulatory frameworks (sets of provisions, requirements and procedures that are mandatory or generally recognised) and certifications (formal confirmation that a specific product meets defined criteria). A regulation does not in itself certify a device; it sets the standard that certification must verify.
Data quality is evaluated against the most demanding methodological frameworks internationally:
- CEN/TS 17660: European technical specification that defines requirements and test methods for sensor systems designed to meet Class 1 Data Quality Objectives (DQO).
- EPA protocols: compliance with the metrics and target values set out in the methodological guidance of the US Environmental Protection Agency, including EPA/600/R-20/279 for O3, EPA/600/R-20/280 for PM2.5, EPA/600/R-23/146 for NO2, CO and SO2, and EPA/600/R-23/145 for PM10.
- MCERTS: official UK certification for indicative measurement equipment for particulate matter (PM1, PM2.5, PM10).
- Grade 1 for PM2.5 (South Korea): the most demanding performance level in the Korean scheme, evaluated by bodies such as KOTITI Testing & Research Institute. (Kunak AIR Pro holds Certification No. KOTITI-2025-14, dated 29 December 2025.)
Independent field evaluations
The devices’ performance has been verified in independent comparative evaluations of international standing, which have confirmed their multi-pollutant accuracy and low variability between units of the same model.
Modular architecture with smart cartridges
The patented cartridge system (Gas&Plug) separates the sensing cell from the main hardware. This modularity means parameters can be changed or added in the field in under two minutes, ensuring that preventive maintenance or end-of-life replacement does not interrupt continuous data capture across the network.
Onboard algorithms and remote drift control
Two complementary strategies are used to counteract environmental effects on the measurement:
- Onboard processing: algorithms built into the instrument apply real-time corrections to compensate for variations in temperature, relative humidity and cross-sensitivities without relying on external reference stations.
- Remote management: through the cloud platform, the baseline (zero) and range (span) can be readjusted remotely using standard operating procedures (SOPs).
Operation in demanding climates and sectors
With enclosures rated to IP65 and an operating temperature range from -30 °C to 60 °C, the sensor is designed to operate in critical environmental conditions. From mining and ports exposed to high levels of dust or salinity to industrial plants and dense urban monitoring networks installed on more than five continents.
Frequently asked questions about choosing an air quality sensor
What is the best air quality sensor?
No single device is universally better than all the others. The best sensor can be considered the one that precisely fits the specific requirements of your project. The right choice depends on the pollutant to be monitored, the expected concentration range, the deployment environment (indoor or outdoor), the required data quality (Data Quality Objectives), the available budget and the operational capacity to handle its maintenance.
How do I know whether an air quality sensor is accurate?
A sensor’s precision and accuracy are verified through independent technical evidence, not just the manufacturer’s datasheet:
- Independent field evaluations: technical reports issued by recognised testing programmes (such as AQ-SPEC at the South Coast AQMD or the EPA).
- Complete performance metrics: correlation (R2) shows how well the sensor follows the reference trend, but it is not enough on its own. To confirm data reliability you also need to examine the slope (close to 1 means it does not systematically overestimate or underestimate), the intercept (close to 0 confirms there is no fixed bias), the mean absolute error (MAE) and the overall uncertainty of the system.
- Calibration traceability: certificates showing that the instrument has been adjusted against traceable calibration gases or primary standard instruments.
- Data transparency: access to full test reports detailing how the unit behaves under varying temperature and humidity.
What certifications should an air quality sensor have?
It is important to distinguish between safety/connectivity certifications and environmental performance certifications:
- Safety and compatibility: CE marking, FCC certification and compliance with directives such as RoHS (restriction of hazardous substances).
- Information security: certification of conformity with Spain’s National Security Framework (ENS), regulated by Royal Decree 311/2022, which attests to the protection of the information systems that handle monitoring data. Kunak holds ENS certification at medium category for the development, maintenance and operation of its devices and sensor management software, and for the Kunak AIR Cloud SaaS platform (web and API), under certificate ENS-1030/26 issued by Applus+ on 17 July 2026.
- Measurement performance:
- CEN/TS 17660: European technical specification for evaluating the performance of air quality sensor systems. It sets out transparent laboratory and field test protocols to classify the quality of the data these instruments provide. It is divided into two parts:
- CEN/TS 17660-1: gaseous pollutants in ambient air regulated by European legislation (O3, NO/NO2/NOx, CO, SO2 and benzene).
- CEN/TS 17660-2: particulate matter in ambient air (PM10 and PM2.5).
- MCERTS: official UK certification for indicative measurement of particulate matter (PM1, PM2.5, PM10).
- Grade 1 for PM2.5 (South Korea): the most demanding performance level in the Korean scheme.
- US EPA methodologies: performance evaluation guidance such as EPA/600/R-20/279 (O3), EPA/600/R-20/280 (PM2.5), EPA/600/R-23/146 (NO2, CO and SO2) and EPA/600/R-23/145 (PM10).
- CEN/TS 17660: European technical specification for evaluating the performance of air quality sensor systems. It sets out transparent laboratory and field test protocols to classify the quality of the data these instruments provide. It is divided into two parts:
- Process and traceability standards:
- ISO 9001: quality management in design and manufacturing.
- ISO/IEC 17025: technical competence of testing and calibration laboratories.
- ISO 6141: traceability of the gas standards used in calibration.
- Independent test protocols: reports issued by accredited laboratories certifying compliance with international test standards for optical or electrochemical sensors.
Do air quality sensors need to be calibrated?
Yes, without exception. All sensing elements (especially electrochemical sensors for gases and optical sensors for particulate matter) undergo progressive degradation and drift over time due to ageing of their components and exposure to extreme environmental conditions. Calibration can be carried out through:
- Initial factory calibration: with calibration gases or in test chambers.
- Field co-location: installing the instrument temporarily next to an official reference station before its final deployment.
- Continuous software adjustment: algorithms that apply baseline corrections (zero drift) and real-time temperature and humidity compensation.
What is the difference between a low-cost sensor and a near-reference sensor?
The difference lies mainly in the rigour of the hardware, the data processing and the reliability of the measurements:
- Low-cost (basic) sensor: uses inexpensive components with no sample conditioning or advanced interference compensation. It is intended for purely indicative use, community awareness or home automation. It has a larger margin of error and greater cross-sensitivity to humidity and temperature.
- Near-reference sensor: combines high-end sensing technologies with physical sample conditioning (such as heated inlet lines), real-time compensation algorithms and strict traceability protocols. Although it does not legally replace a regulatory reference station, it delivers data quality very close to one, with high consistency between units, allowing well-founded operational and technical decisions.
Data quality should decide the purchase
Choosing an environmental monitoring solution is not simply a decision about equipment or budget; it is a strategic decision about the robustness of the information that will guide the project. A device that gives inaccurate or unstable readings is not just useless: it can lead to wrong operational decisions, regulatory penalties, misdirected investment or an irreparable loss of credibility with the community and the authorities.
When selecting the right technology, the analysis must always go beyond the initial purchase cost. It is essential to evaluate the system as a whole, from the sample conditioning electronics to the remote diagnostic tools and the total cost of ownership, and always to demand independent technical evidence to back up every claim the manufacturer makes.
Ultimately, the principle that should guide the choice is that you are not simply buying a sensor; you are acquiring the ability to trust the decisions that will be made with its data.
If the measurements are going to support financial investment, legal compliance, public health protection or critical operational plans, the goal is not how much the sensor measures, but how far you can trust what it measures.
References
- Chacón-Mateos, M., García-Salamero, H., Laquai, B. and Vogt, U. (2025). Calibration and performance evaluation of PM2.5 and NO2 air quality sensors for environmental epidemiology. Atmospheric Measurement Techniques, 18(16), 4061–4085. https://doi.org/10.5194/amt-18-4061-2025
- US EPA (2021). Performance testing protocols, metrics, and target values for fine particulate matter air sensors. EPA/600/R-20/280. https://www.epa.gov/air-sensor-toolbox/air-sensor-performance-targets-and-testing-protocols
- US EPA (2021). Performance testing protocols, metrics, and target values for ozone air sensors. EPA/600/R-20/279.
- US EPA (2024). Supplements to the performance testing protocols and target values for NO2, CO and SO2 sensors (EPA/600/R-23/146) and PM10 sensors (EPA/600/R-23/145). https://www.epa.gov/sciencematters/epa-adds-performance-testing-protocols-and-targets-no2-co-so2-and-pm10-air-sensors
- European Committee for Standardization (2021). CEN/TS 17660-1:2021. Air quality. Performance evaluation of air quality sensor systems. Part 1: Gaseous pollutants in ambient air. https://www.en-standard.eu/pd-cen-ts-17660-1-2021-air-quality-performance-evaluation-of-air-quality-sensor-systems-gaseous-pollutants-in-ambient-air/
- European Committee for Standardization (2024). CEN/TS 17660-2:2024. Air quality. Performance evaluation of air quality sensor systems. Part 2: Particulate matter in ambient air. https://www.en-standard.eu/pd-cen-ts-17660-2-2024-air-quality-performance-evaluation-of-air-quality-sensor-systems-particulate-matter-in-ambient-air/
- European Commission (6 November 2025). Air pollution data from citizen-operated sensors improved by novel quality control system. https://environment.ec.europa.eu/news/air-pollution-data-citizen-operated-sensors-improved-novel-quality-control-system-2025-11-06_en