Atmospheric conditions are essential to prevent damage to human health and to reduce the causes of increased mortality or serious effects of exposure to poor air qualityAir quality refers to the state of the air we breathe and its composition in terms of pollutants present in the atmosphere. It is considered good when poll...
Read more. Air pollutantsAir pollution caused by atmospheric contaminants is one of the most critical and complex environmental problems we face today, both because of its global r...
Read more are also linked to the environmental degradation of terrestrial and aquatic ecosystems under harmful atmospheric conditions.
To limit the emission of such pollutants into the atmosphere, the first step is to monitor air quality. Perimeter emission monitoring networks in urban, odour, construction and industrial areas have proven to be an effective tool for environmental monitoring. They make it possible to analyse the pollutants present in the air and to determine their proportion at any given time at a low economic cost.
Perimeter air pollution monitoring systems are based on the continuous monitoring of the atmosphere through the installation of a network of devices or sensors. They operate in a constant mode, as there are no safe levels of pollution, providing accurate and reliable information in real-time.
Sensors in perimeter monitoring networks detect pollutants and determine their levels in the air over a defined area. They provide a complete and continuous measurement over time and are independent of the size of the area being monitored. The monitoring network is based on a series of sampling points whose location is considered representative on the basis of various factors such as population concentration, industrial activity, predominant pollutants, orography, meteorological characteristics, etc.
It is a simple technological system that has proved to be indispensable for monitoring and guaranteeing air quality at any given place and time.
Air Quality Innovation in Just 1 Click
Stay informed about the air you breathe!
Subscribe to our newsletter to receive the latest updates on environmental monitoring technology, air quality studies, and more.
In both industrial and urban environments, or those associated with productive sectors such as agriculture, construction and demolition sites, or waste treatment (landfills, sewage treatment plants, etc.), ambient air pollution monitoring is essential to control suspended particles and other relevant atmospheric pollutants.
With their presence and continuous operation at strategic points around the areas to be monitored and their surroundings, ambient air monitoring networks are an environmental defence against air pollution and the way to achieve clean air.
It is essential to comply with the regulations in force in each region and country, as air pollution knows no borders and is a global environmental problem. Perimeter air quality monitoringControlling air quality is an essential task in order to enjoy optimal environmental conditions for healthy human development and to keep the environment i...
Read more has become an important tool to ensure compliance with environmental regulations and to promote responsible practices in the management of air emissions.
The information provided by the sensors helps to protect public health from harmful substances and environmental damage caused by air pollution episodes.
These monitoring and control networks also facilitate the timely implementation of corrective measures in the event of an alert due to an exceedance of legally permitted pollutant thresholds.
What makes up a fenceline air pollution monitoring network?
For an ambient monitoring network to provide a reliable system for monitoring air quality in a given area, it must have
-
- An adequate number of strategically placed sensors to provide comprehensive monitoring of the area.
- Sensors capable of measuring in real time the key pollutants according to the industrial or urban process.
- Accurate and stable calibration of the sensors so that their measurements are reliable over time.
- They should be installed at a distance from the emission sources so that the sampling of immissions is reliable and not affected by point production processes.
- Reduced intra-model variability, i.e. that measurements from all sensors in the network are consistent, reliable and accurate.
- A platform for analysing the data collected from the network to provide an overview of the various pollutants and monitoring throughout the area.
- To have the necessary tools to enable informed decision-making based on the levels of each pollutant at each monitoring point.
- To have a system of alerts when thresholds are exceeded, allowing the detection of anomalies in production processes.
- A system for the generation of simple and agile reports.
- Connection with the competent control bodies to activate their intervention in situations where a pollutant exceeds the established limits.
- Creation of digital media such as websites, mobile applications or widgets to show air pollution data to the public in a simple and understandable way.
- Possibility of establishing personalised analyses.
What does a fenceline monitoring network for air pollution control measure?
The fenceline air quality monitoring networksAir quality monitoring networks consist of an organised system of monitoring stations distributed across various locations to measure and assess air pollut...
Read more measure a series of basic pollutants that have a direct impact on the assessment of air quality, and whose limits are set according to the regulations and laws in force due to their negative impact on public health and the environment. The main pollutants include particulate matter, sulphur dioxide, nitrogen dioxide, carbon monoxide and tropospheric ozone, among others.
The incorporation of advanced technologies, such as the latest sensors and remote monitoring systems, is beneficial to improve the accuracy and efficiency of fenceline air quality monitoring networks.
How is fenceline air pollution monitoring carried out?
The first step before installing a fenceline air quality monitoring network is to know the particular atmospheric situation of the area and the potential risks of emissions that it may suffer directly or to identify possible exposures to pollutants transported by meteorological agents such as wind. In this way, the specific parameters to be measured are determined by means of specific sensors.
The proper selection of pollutants to be measured is crucial because it is their presence or absence that ultimately determines air quality. At the same time, their monitoring facilitates early detection of exceedances of permitted levels. This is when the alert is triggered, indicating the need to take appropriate measures to reduce air pollution.
Fenceline air pollution monitoring sensor networks are based on a previous and detailed study on the appropriate location of the devices at the local level and over the whole area to be monitored. Their strategic location depends on their accuracy in capturing representative data from which to establish air quality.
In this way, they track pollutants at strategic locations on the boundaries of an industrial facility to measure the level of pollution in these production facilities.
Similarly, fenceline air monitoring networks can be used strategically to monitor communities. Through the measurements provided by their permanent sensors, the level of pollution to which people living in the community are exposed is known and trends are tracked over time to ensure optimal environmental conditions.
What are fenceline monitoring networks useful for?
In addition to providing a quantitative, spatial and temporal definition of air quality in a given area, ambient monitoring also provides important information that is a suitable source for
-
- Identify and control sources of emissions.
- Provide accurate immission data.
- Complement official monitoring networks.
- Measure the impact of emissions on the environment.
- Identify critical points of pollutant emissions.
- Limit the impact of activities on air quality.
- Evaluate improvements or work carried out.
- Detect possible leaks and fugitive emissions (anomalous processes).
- Optimise processes.
- Reduce maintenance costs.
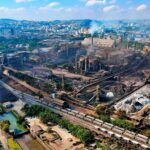 Fenceline monitoring at industrial sites: continuous monitoring and emission detection
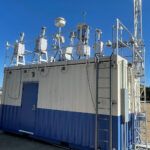 Near-reference monitoring: advanced accuracy in air quality measurement
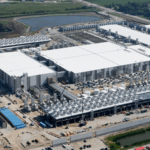 Data center air quality monitoring: applications, parameters and sensors
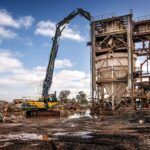 Remediation air monitoring: real-time emissions control and compliance
 PM10 measurement in coarse particle environments: why sensor technology matters