Background
Particulate matter (PM)Atmospheric particulate matter are microscopic elements suspended in the air, consisting of solid and liquid substances. They have a wide range of sizes an...
Read more is not a single pollutant, but a mixture of particles of different sizes, compositions, and origins. The size of these particles determines how long they remain suspended in the air and how deeply they penetrate the human respiratory system.
For regulatory and environmental monitoring purposes, two fractions are especially relevant:
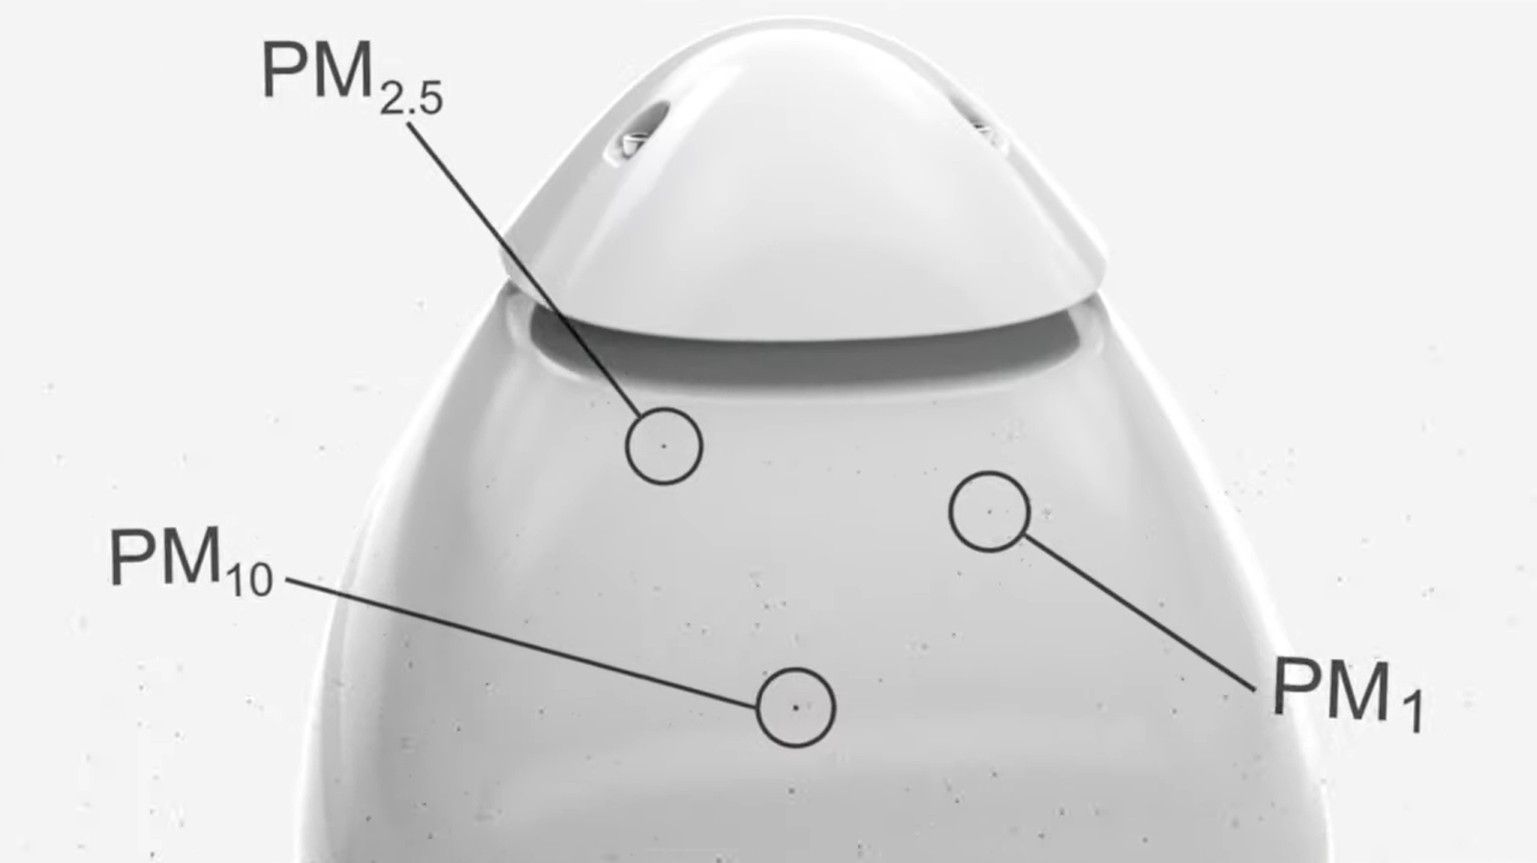
- PM2.5: particles with a diameter below 2.5 µm, typically associated with combustion processes.
- PM10: particles with a diameter below 10 µm, which include both fine particles (PM2.5) and coarse particles (PM2.5–10).
A correct distinction between fine particles (PM2.5) and coarse particles (PM2.5-10) is essential, since these fractions originate from different sources, have distinct transport mechanisms, and exhibit markedly different health and environmental effects.
In particular, the presence of coarse particles is strongly associated with mechanical processes, such as soil disturbance, material handling, traffic over unpaved surfaces, mining, port activities, agricultural operations, or construction and demolition work. These environments can produce high concentrations of particles in the 2.5–10 µm range, making accurate PM10 quantification particularly demanding.
Types of low-cost PM sensors
In recent years, low-cost PM sensors have become widely adopted. However, not all sensors measure PM10 in the same way.
Air Quality Innovation in Just 1 Click
Stay informed about the air you breathe!
Subscribe to our newsletter to receive the latest updates on environmental monitoring technology, air quality studies, and more.
Broadly speaking, two technical approaches exist:
Sensors that estimate PM10 from PM2.5
Some optical sensors are primarily optimized for fine particle detection. Those sensors apply fixed particle-size ratios to extrapolate PM10 from measured PM2.5 values. In such sensors, PM10 is not directly measured, but it is inferred based on assumed particle distributions.
This approach can perform reasonably well in urban environments dominated by fine particles, but it may introduce significant bias in environments where coarse particles are prevalent.
Sensors based on Optical Particle Counter (OPC) Technology
Optical Particle Counter (OPC) technology, such as the one included in the Kunak AIR Pro, uses laser light scattering to individually detect and size particles across multiple diameter ranges.
The main features of OPC sensor:
- Measures across an extended size range (beyond 10 µm)
- Includes sufficient size channels to resolve particle distributions.
This enables true particle size discrimination, coarse fraction detection and direct PM10 calculation without relying on assumed ratios.
In coarse-particle environments, this distinction is critical.
Objective of this study
This article presents field validation results of the Kunak AIR Pro PM sensor under conditions with elevated coarse-particle concentrations.
The results demonstrate that the sensor maintains strong accuracy and agreement with equivalent instrumentation in PM10 measurement, even in environments where coarse particles dominate.
These findings confirm Kunak PM sensor suitability for regulatory, industrial, urban, and occupational applications where reliable PM10 data are essential for environmental compliance, operational control, and public health protection.
Kunak AIR Pro – PM sensor
The Kunak PM sensor is based on laser light scattering technology and is certified under the MCERTS Certified Products: Indicative Ambient Particulate Monitors for PM10 and PM2.5. It also holds KOTITI Grade 1 certification for PM2.5, further validating its performance and measurement reliability.
Kunak AIR Pro stations integrate an OPC (Optical Particle Counter) capable of measuring particles from 0.3 μm up to 40 μm thanks to 24 bin channels.
PM1, PM2.5, PM4, PM10, Total Suspended Particles (TSP) and Total Particle Counter (TPC) are calculated assuming a particle density profile.
Field co-location studies have shown similar field performance as equivalent instruments based on the same technology, even in monitoring coarse particles.
The effect of humidity is perfectly corrected with the embedded algorithm achieving high accuracy at any environmental conditions, except under foggy days or condensation, where the data is automatically invalidated by the software Kunak AIR Cloud to prevent data noiseImagine waking up every morning at 5:00 a.m. to the relentless roar of a motorway just metres from your window. Experiencing such high-intensity noise is n...
Read more.
Besides, the remote Kunak calibration tool allows you to adjust the correction factor to the specific location where the device is installed.
Kunak AIR Pro – Professional PM sensor for measuring PM1, PM2.5, PM4, PM10, Total Suspended Particles (TSP) and Total Particle Counter (TPC)
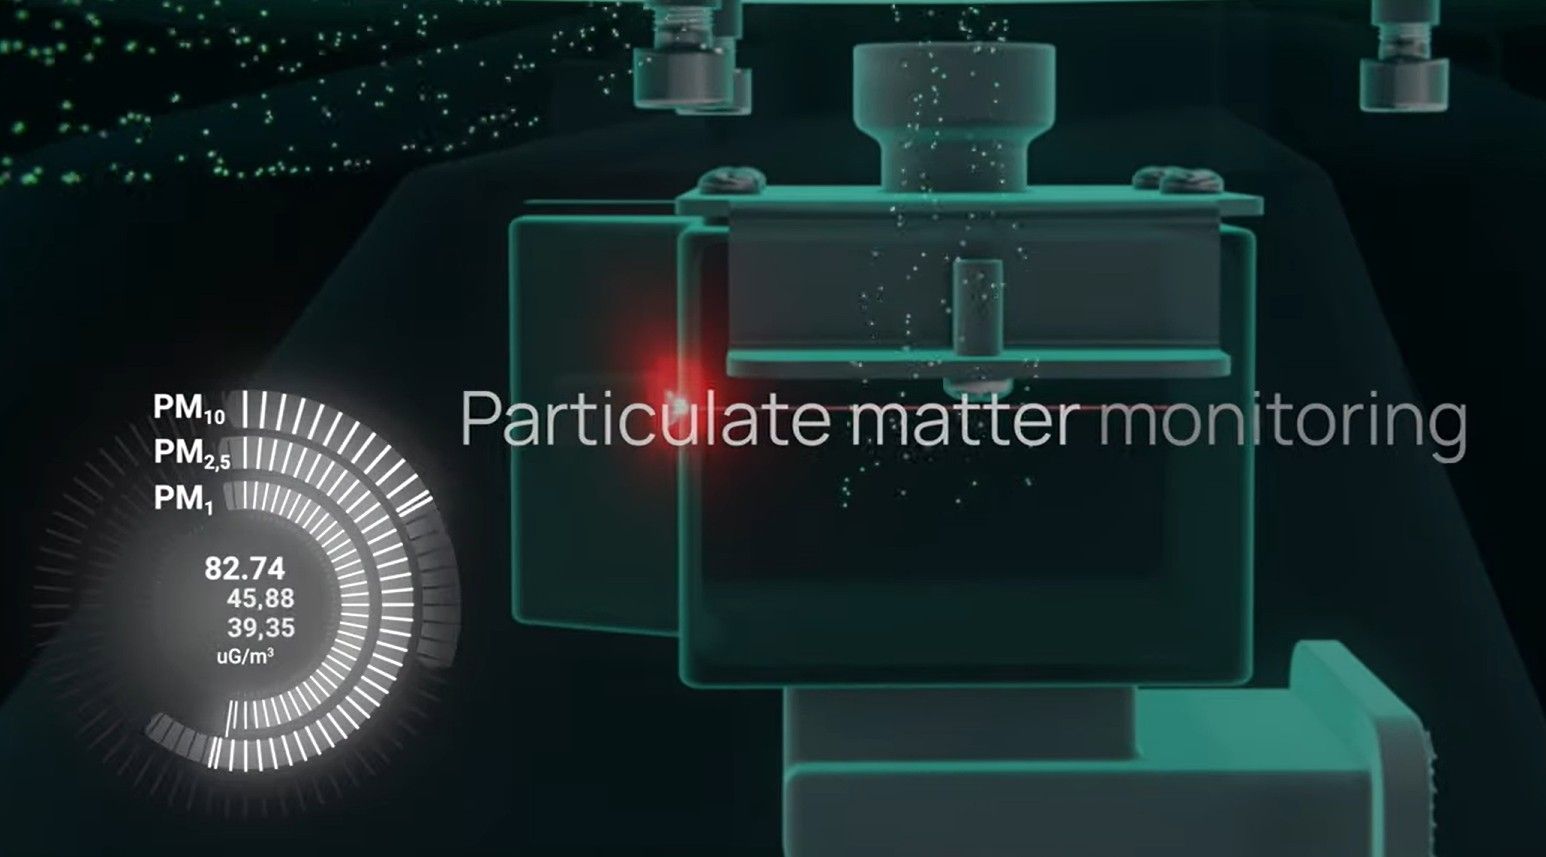
Rendered image of the OPC (Optical Particle Counter) of the Kunak AIR Pro
Technical specifications of the PM Type A sensor (only for Kunak AIR Pro)
| Type | Optical particle counter | Repeatability (9) | 2 µg/m3 (PM1) 3 µg/m3 (PM2.5) 3 µg/m3 (PM4) 5 µg/m3 (PM10) 6 µg/m3 (TSP) |
| Unit of measurement | µg/m3 | Limit of Detection (LOD) (8) | 0.5 µg/m3 (PM1) 0.5 µg/m3 (PM2.5) 0.5 µg/m3 (PM4) 1 µg/m3 (PM10) 1 µg/m3 (TSP) |
| Measurement range (1) | 0 – 1,000 µg/m3 (PM1) 0 – 2,000 µg/m3 (PM2.5) 0 – 2,000 µg/m3 (PM4) 0 – 10,000 µg/m3 (PM10) 0 – 15,000 µg/m3 (TSP) 0 – 8,000 counts/cm3 (TPC) | Typical accuracy (12) | ± 2 µg/m3 (PM1) ± 3 µg/m3 (PM2.5) ± 3 µg/m3 (PM4) ± 4 µg/m3 (PM10) ± 6 µg/m3 (TSP) |
| Resolution (2) | 1 µg/m3 1 count/cm3 (TPC) | Typical precision – R2 (11) | > 0.9 (PM1) > 0.8 (PM2.5) > 0.8 (PM4) > 0.7 (PM10) > 0.7 (TSP) > 0.8 (TPC) |
| Operating temperature range (3) | -20 to 50 °C -40 to 50 °C with heater ** | Typical slope (11) | 0.85 – 1.18 |
| Operating RH range (4) | 0 to 99 %RH | Typical intercept (a) (11) | -1.8 µg/m3 ≤ a ≤ +1.8 µg/m3 (PM1) -2 µg/m3 ≤ a ≤ +2 µg/m3 (PM2.5) -2 µg/m3 ≤ a ≤ +2 µg/m3 (PM4) -3 µg/m3 ≤ a ≤ +3 µg/m3 (PM10) -4 µg/m3 ≤ a ≤ +4 µg/m3 (TSP) |
| Recommended RH range (5) | 0 to 95 %RH | DQO – Typical U(exp) (13) | < 50% (PM1 – PM4 – PM10 – TSP) < 35% (PM2.5) |
| Operating life (6) | > 24 months | Typical intra-model variability (14) | < 2 µg/m3 |
| Response time (10) | < 10 sec | ||
| 1. Measurement range: concentration range measured by the sensor. 2. Resolution: smallest unit of measurement that can be indicated by the sensor. 3. Operating temperature range: temperature interval at which the sensor is rated to operate safely and provide measurements. (**) In PM sensor Type A: -40 to 50ºC with heater (more information on this version on request). 4. Operating RH range: humidity interval at which the sensor is rated to operate safely and provide measurements. 5. Recommended RH range: recommended relative humidity range for optimal sensor performance. Continuous exposure outside the recommended range may damage the cartridge. 6. Operating life: time period during which the sensor can operate effectively and accurately under normal conditions. 7. Guarantee range: concentration range covered by Kunak’s guarantee. 8. LOD (Limit of detection): measured at laboratory conditions at 20ºC and 50% RH. The limit of detection is the minimum concentration that can be detected as significantly different at zero gas concentration, calculated according to the Technical Specification CEN/TS 17660. 9. Repeatability: measured at laboratory conditions at 20ºC and 50% RH. Closeness of the agreement between the results of successive measurements of the same measure carried out under the same conditions of measurement, calculated according to the Technical Specification CEN/TS 17660. 10. Response time: time needed by the sensor to reach 90% of the final stable value. 11. Typical precision – R2: statistics obtained between the device hourly measurements and reference instruments in field test between -10 to +30ºC at different locations. (*) For the type B PM sensor, the expected error for PM 10 is higher in presence of coarse particles. 12. Typical accuracy: for criteria pollutants is the average Mean Absolute Error (MAE) obtained between the device hourly measurements and reference instruments for 1 to 8 months field test between -10 to +30ºC in different countries. For other pollutants is the expected error of the measurement at the reading. 13. DQO-Typical U(exp): Data Quality Objective expressed as the Expanded Uncertainty in the Limit Value obtained between the device hourly measurements and reference instruments for 1 to 8 months field test between -10 to +30ºC in different countries, calculated according to the European Air QualityAir quality refers to the state of the air we breathe and its composition in terms of pollutants present in the atmosphere. It is considered good when poll... Read more Directive 2024/2881 and from the Technical Specification CEN/TS 17660. (*) For the type B PM sensor, the expected error for PM 10 is higher in presence of coarse particles. 14. Typical intra-model variability: calculated as the standard deviation of the three sensor means in 1 to 8 months field test between -10 to +30ºC in different countries. |
|||
Additionally, particle size distributions plots are available in Kunak AIR Cloud.
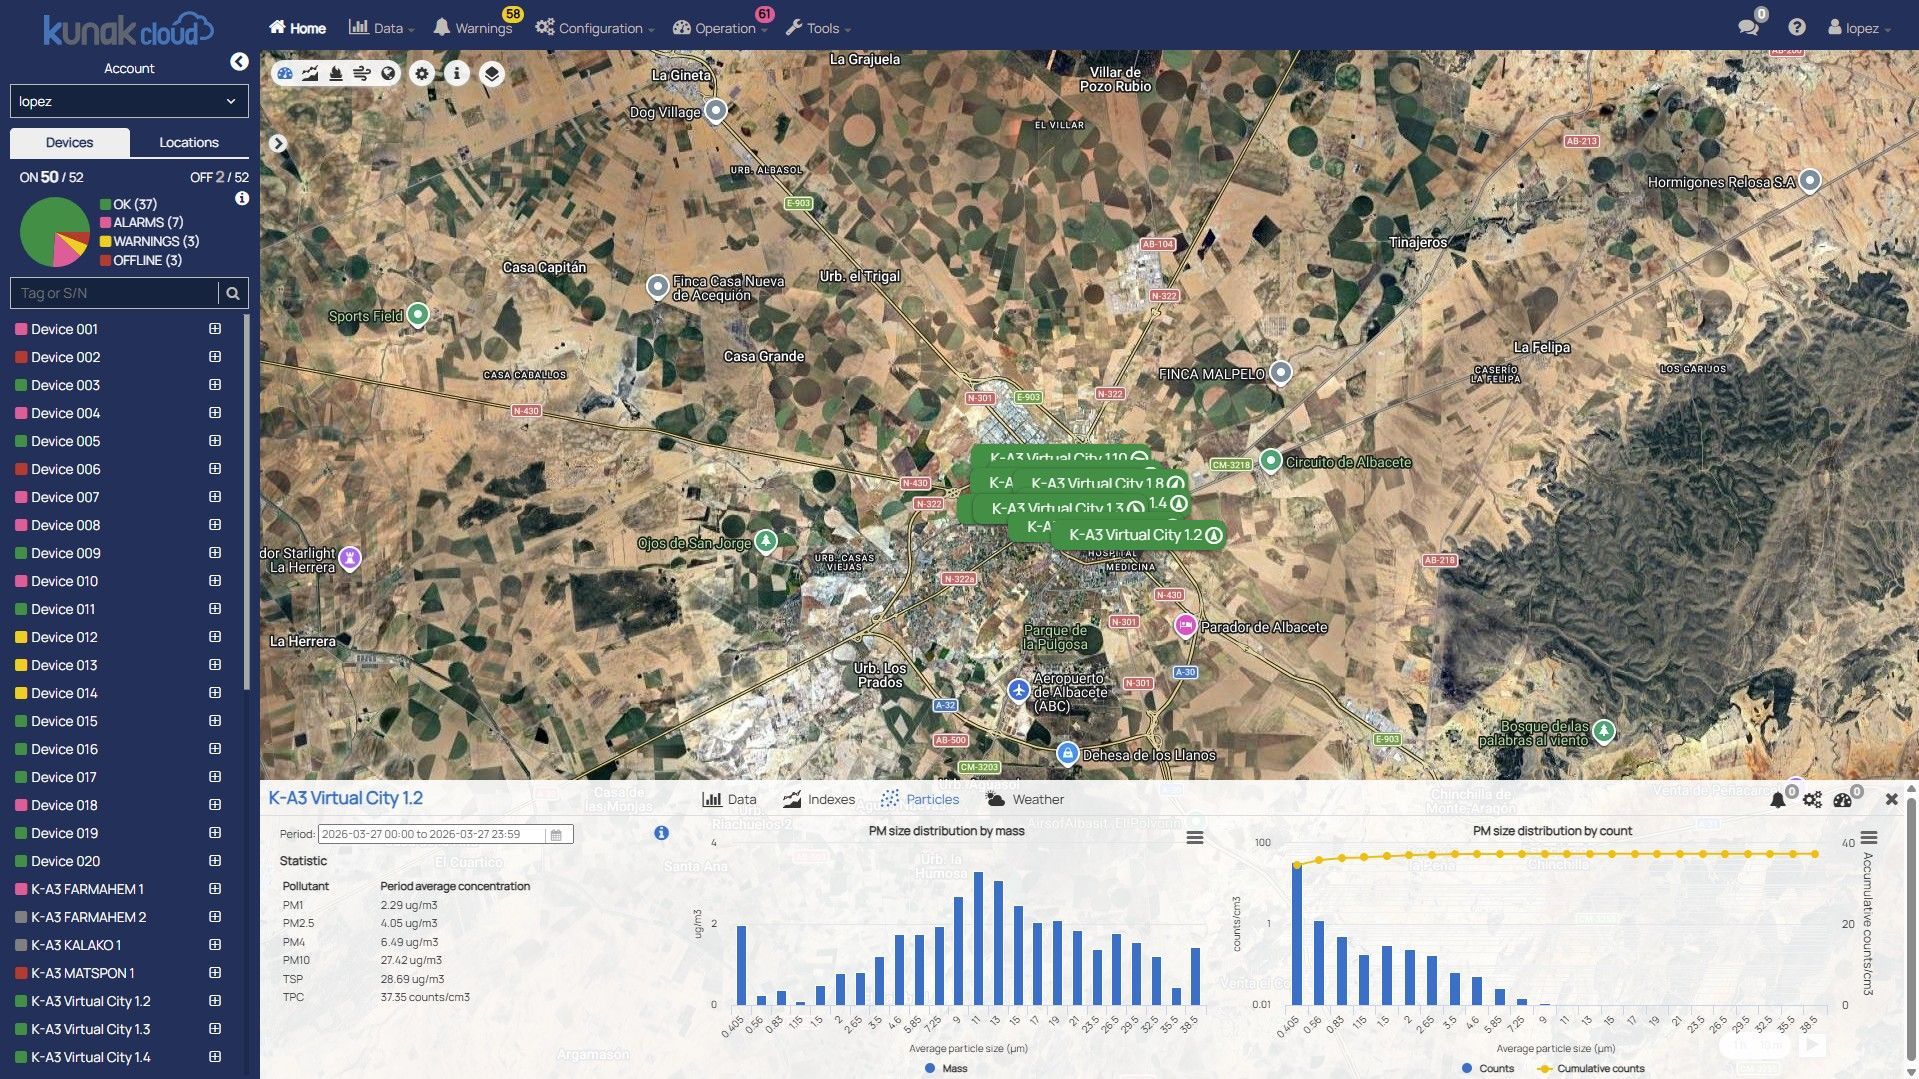
Figure 1.
PM distribution and size analysis tool
Demonstration of accuracy for PM10 measurements
Analysis and characterization procedure
The next metrics and plots are evaluated to assess the performance of the PM sensor in the field test.
- Accuracy: is obtained as the mean absolute error (MAE) between KUNAKAIR measurements and the reference instruments.
- 90% confidence interval: 90% of the measurements are below this error. Also, the relative error of the maximum error in the 90% of measurements is shown.
- Results also include the average concentration (AVG. GC) during the whole tests.
- Temporal plots, Scatter plots and Time Variation of the Mean are used to analyze the test results.
1. Field test: Helsinki (Finland)
- LOCATION: Teollisuuskatu, Helsinki (Finland)
- TEST PERIOD: 20th February – 28th April 2025
Table 1. Environmental conditions of the field test
Table 2. Statistics of PM2.5 and PM10 measured by the air quality monitoringControlling air quality is an essential task in order to enjoy optimal environmental conditions for healthy human development and to keep the environment i...
Read more station (Reference)
Figure 2 shows how PM10 concentration is higher than PM2.5, demonstrating the high concentration of coarse particles (PM10 – PM2.5) monitored during the field test.
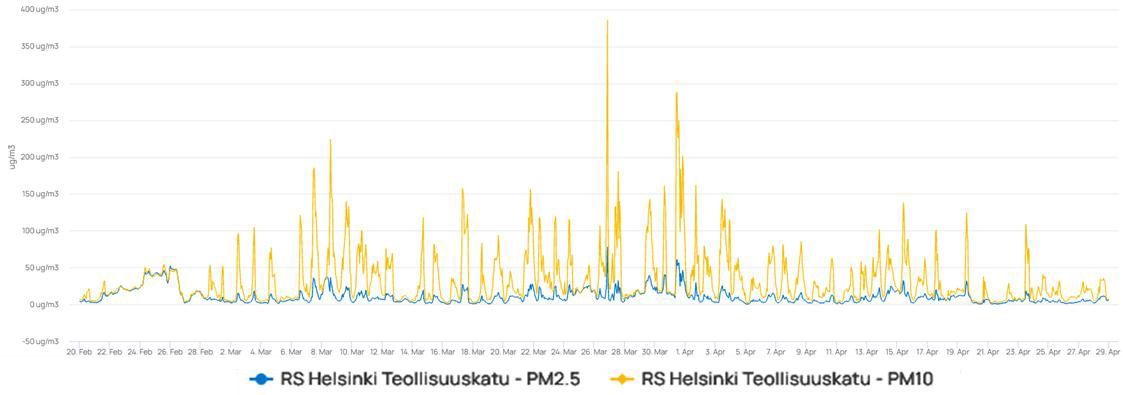
Figure 2.
Reference PM2.5 and PM10 temporal plot.
The next figure (Figure 3) shows the Temporal plot showing the measurements monitored by the reference station and the two Kunak devices. As observed, there are several peaks over the 190 µg/m3 limit. Besides, it is observed how Kunak PM10 measurements are aligned with the PM10 measurements monitored by the particulate matter analyzer. The good correlation between Kunak devices and reference data are shown in Figure 3, in which the scatter plot, the correlation (R2) and the linear equation are shown. Both devices show a perfect correlation, over 0.80, which has a slope close to 1 and a small offset (below 2 µg/m3).
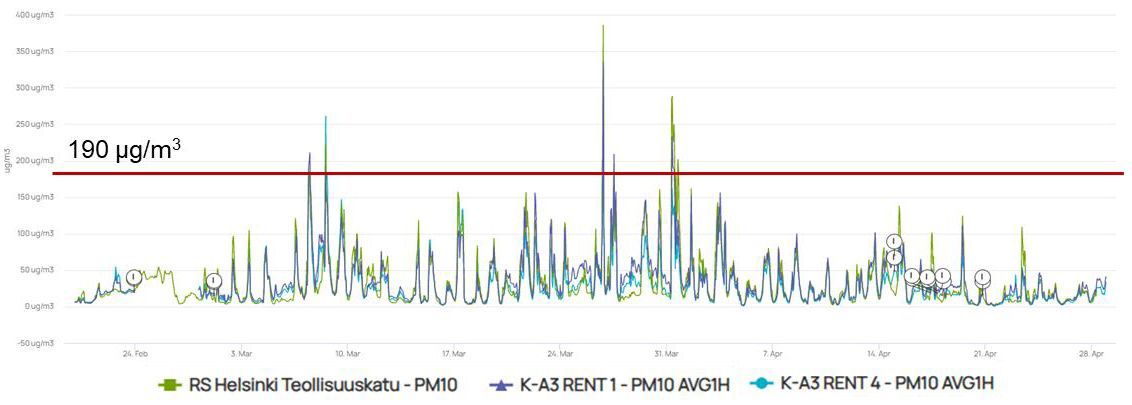
Figure 3.
Temporal plot of PM10 reference data (green), and Kunak PM10 measurements: devices K-A3 RENT 1 (purple) and K-A3 RENT 4 (blue). Red line shown the limit of PM10 concentration 190 µg/m3.
Figure 4 shows the Time Variation plot, in which it is observed how Kunak PM sensors from both devices follow perfectly the trends of PM10 measure by the equivalent instrument.
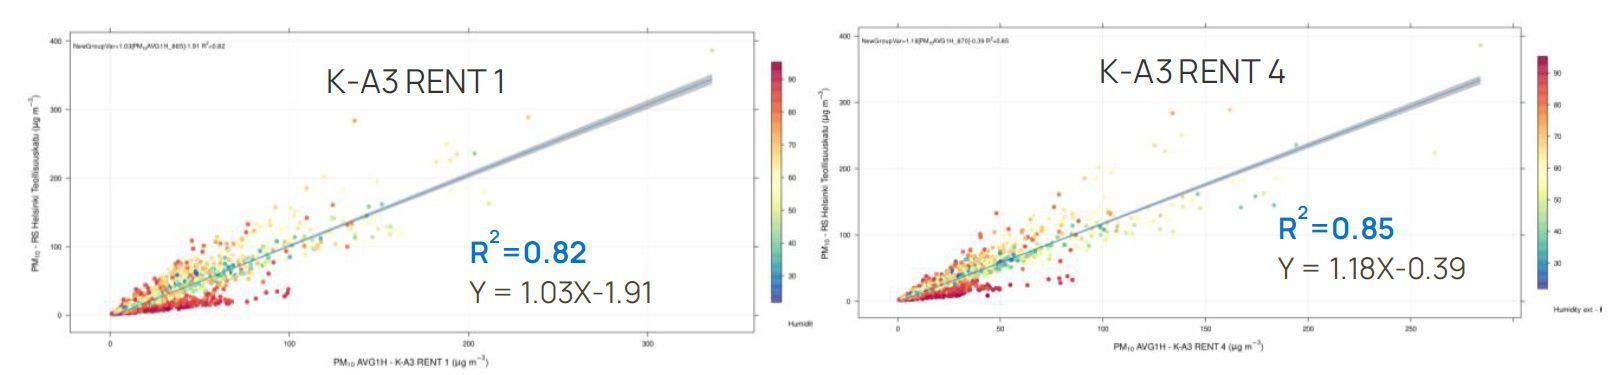
Figure 4.
Scatter plot of Kunak devices (x axis) vs. reference data (y axis), and humidity range (z axis). The plot shows the correlation and the linear equation.
The Figure 5 shown how PM10 concentration is higher than PM2.5, showing high concentration of PM coarse (PM10 – PM2.5) monitored during the field test.
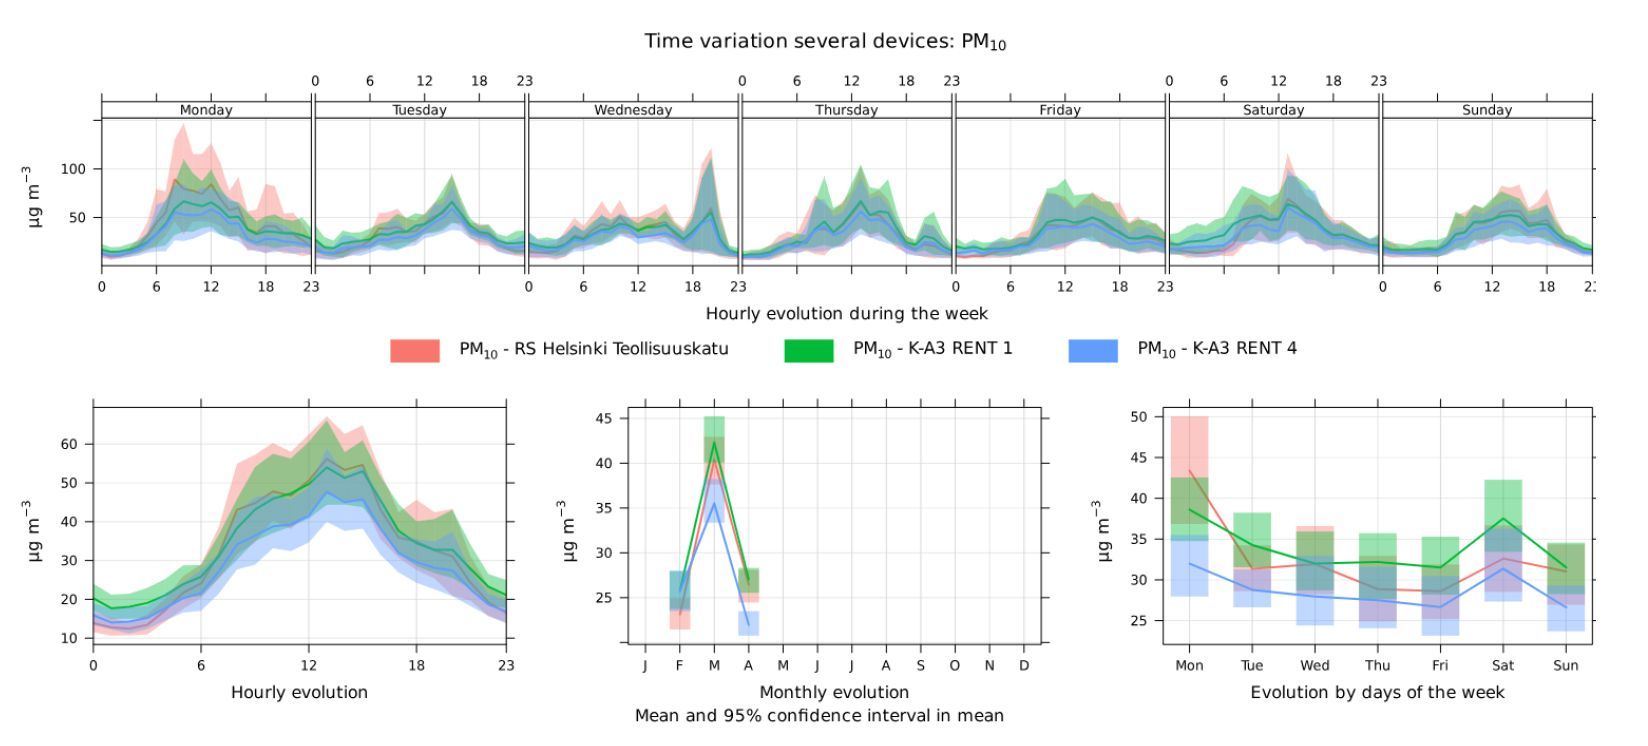
Figure 5.
Time Variation of PM10 reference (red) and both Kunak PM10 measurements (green and blue).
The table below (Table 3) shows the analysis metrics described in the Analysis and characterization procedure section. It is observed not only the good correlation obtained in the field test, but also the low MAE and the good 90% confidence interval. Besides, it is observed how the average concentration monitored by the reference and by the Kunak AIR Pro devices (DUT: Device Under Test) are very similar.
Table 3. Analysis metrics
All these plots and statistics show the good performance of the PM sensor to monitor high concentration of PM10 in presence of coarse particles.
2. Field test: Accra (Ghana)
- LOCATION: Accra, (Ghana)
- TEST PERIOD: 8th January – 18th February 2024
Table 4. Environmental conditions of the field test
Table 5. Statistics of PM2.5 and PM10 measured by the air quality monitoring station (Reference)
The next figure (Figure 6) shows the Temporal plot showing the measurements monitored by the reference station and the three Kunak AIR Pro devices. As observed, there are around two weeks in which the concentrations are over the 190 µg/m3 limit most of the time. The plot shows how Kunak PM10 measurements are aligned with the PM10 measurements monitored by the particulate matter analyzer.
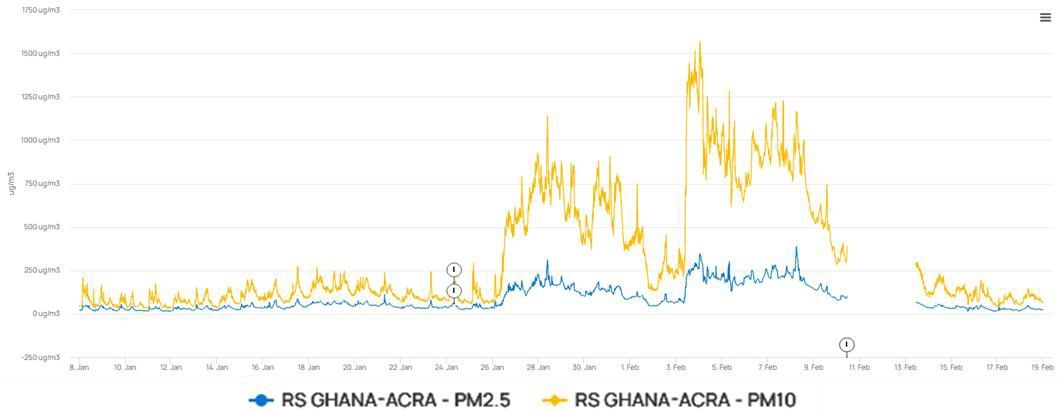
Figure 6.
Reference PM2.5 and PM10 temporal plot.
The good correlation between Kunak AIR Pro devices and reference data are shown in Figure 7, in which the scatter plot, the correlation (R2) and the linear equation are shown. The three Kunak AIR Pro sensor systems show a excellent correlation, over 0.87, which a slope close to 1. In this case, due to the very high concentration, the offset is slightly higher (around 26-40 µg/m3). Considering concentration over 250 µg/m3, this intercept could be considered negligible.
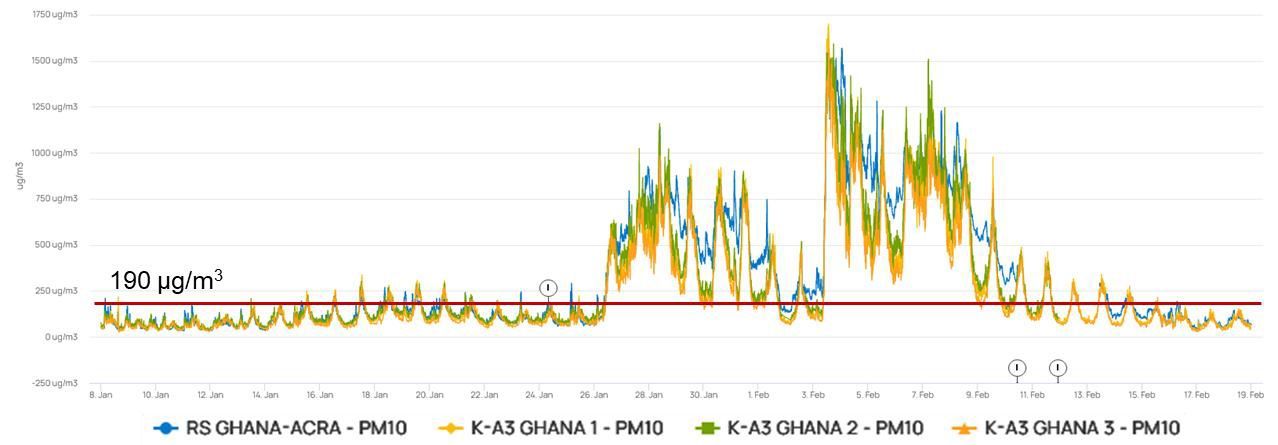
Figure 7.
Temporal plot of PM10 reference data (blue), and Kunak PM10 measurements: devices K-A3 GHANA 1(yellow), K-A3 GHANA 2 (green) and K-A3 GHANA 3 (orange). Red line shown the limit of PM10 concentration 190 µg/m3.
Figure 8 shows the Time Variation plot, in which it is observed how Kunak PM sensors from three devices follow perfectly the trends of PM10 measure by the reference analyzer.
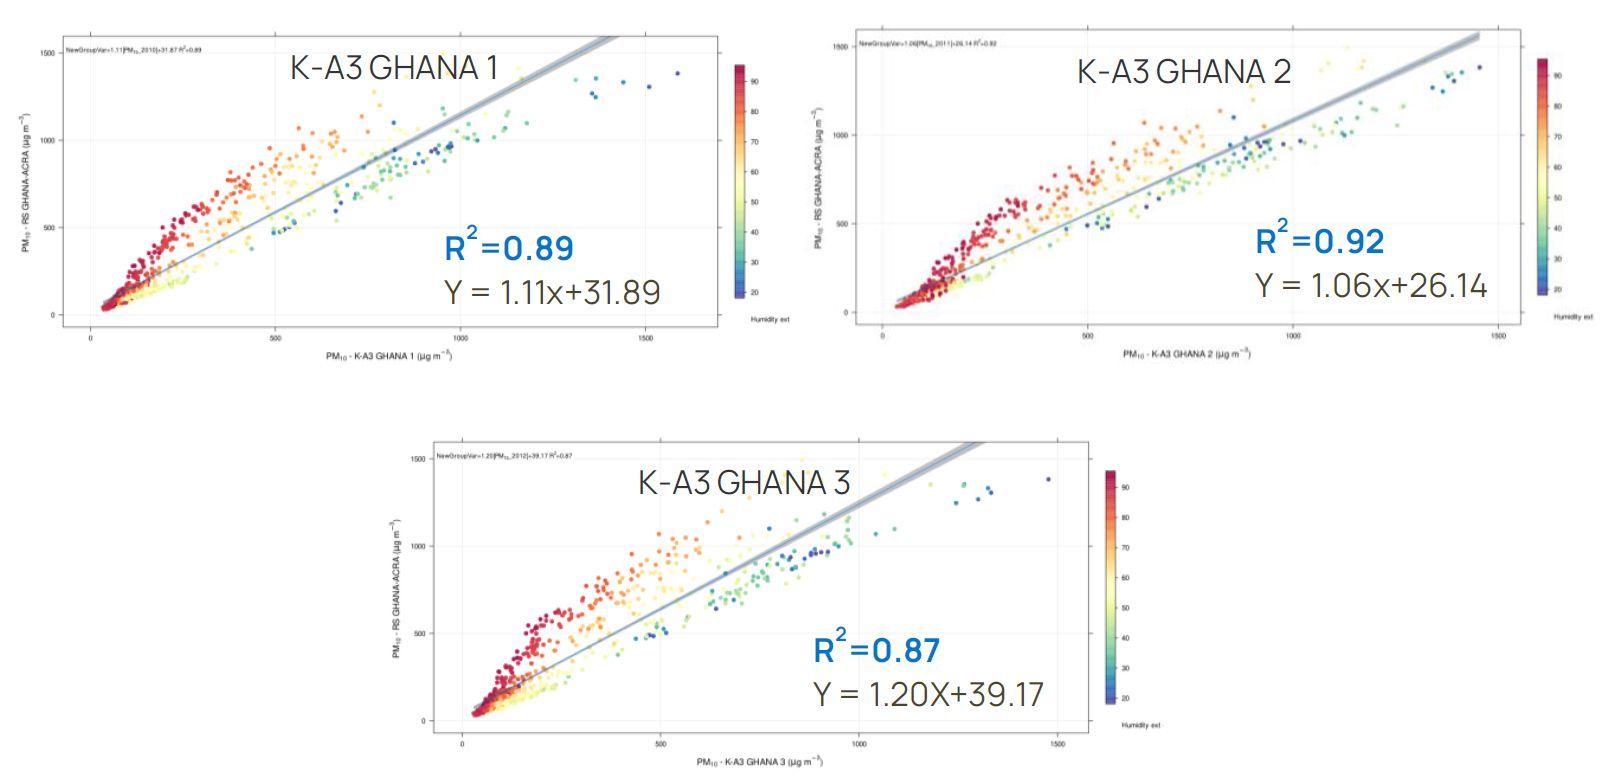
Figure 8.
Scatter plot of Kunak devices (X axis) vs. reference data (y axis), and humidity range (z axis). The plot shows the correlation and the linear equation.
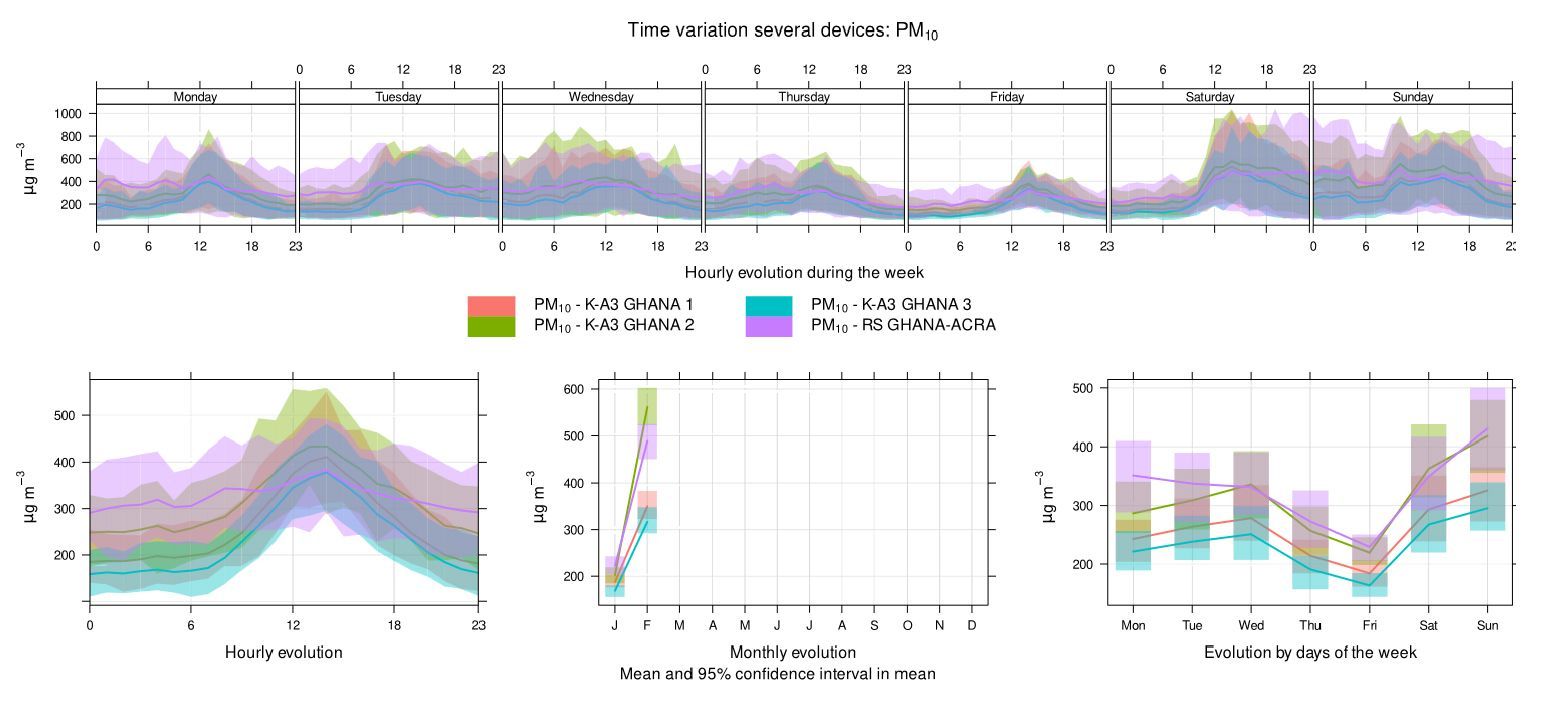
Figure 9.
Time Variation of reference (purple) and the three Kunak PM10 measurements (red, green and blue)
Finally, table 6 shows the analysis metrics described in the Analysis and characterization procedure section where the excellent correlation obtained in the field test is shown.
As mentioned before, due to the very high concentrations, the MAE and the 90% confidence interval are higher than in Helsinki field test. This is expected as the concentration range is from 32.35 to 1493.94 µg/m3.
Last, the table shows the average concentration monitored by the reference and by the DUT (Device Under Test), showing very similar average concentration monitored within the different technologies.
Table 6. Analysis metrics.
All these plots and statistics show the good performance of the PM sensor to monitor high concentration of PM10 in presence of coarse particles.
Conclusions
The field tests carried out in Helsinki (Finland) and Accra (Ghana) demonstrate that the PM sensor integrated into the Kunak AIR Pro delivers solid and consistent performance, even under conditions with high concentrations of coarse particles.
In both locations, the Kunak AIR Pro devices showed strong performance with reference analyzers, with correlation values (R2) above 0.80 in Helsinki and above 0.87 in Accra, confirming their ability to accurately reproduce PM10 trends and absolute concentration levels.
Results indicate that the sensor maintains stable behaviour across a wide range of temperatures, humidity levels and particle loads, preserving high accuracy in both moderate conditions and severe pollution episodes. Although MAE and 90% confidence intervals increase under extremely high concentrations, as expected due to the broader operating range found in Accra, the close alignment between Kunak AIR Pro devices and the PM equivalent instruments confirms the robustness of the system.
Its capacity to accurately follow temporal variations, detect concentration peaks, and maintain strong agreement with reference-grade equipment makes it well suited for industrial, urban and operational monitoring in construction and demolition scenarios, where trustworthy air quality data is essential for decision-making and environmental management.