
Air qualityAir quality refers to the state of the air we breathe and its composition in terms of pollutants present in the atmosphere. It is considered good when poll...
Read more monitoring in data centres is the continuous or periodic measurement of atmospheric contaminants generated by installations across construction, operation and decommissioning phases. Unlike traditional industrial sources, data centre emissions are intermittent (from diesel generators and power failures), diffuse (distributed across cooling systems and auxiliary equipment) and multisource, making them harder to characterise than predictable point-source pollution. The US EPA selected real-time monitoring as a critical tool for this application; in February 2026, Virginia’s Department of Environmental Quality (DEQ) launched its Data Center Air Monitoring Project in Loudoun County, deploying seven sensor units across 22 potential locations to measure NO2, CO and PM2.5 and quantify cumulative community impact. This monitoring represents a fundamental shift: from estimating emissions to measuring them with regulatory-grade instruments, enabling data centre operators to demonstrate compliance to environmental administrations, neighbouring communities and financial markets with verifiable, auditable data rather than declarations alone.
Whenever a company trains an AI model, holds a video call or accesses a file in the cloud, a physical installation somewhere in the world consumes energy, dissipates heat and, in many cases, engages a diesel generator. Until now, that reality has remained invisible in environmental reports across the digital sector. But that is no longer possible.
Air quality monitoringControlling air quality is an essential task in order to enjoy optimal environmental conditions for healthy human development and to keep the environment i...
Read more in data centers consists of the continuous or periodic measurement of atmospheric contaminants generated by these installations across all operational phases: construction, operation and decommissioning. The principal emission sources in an operating data center are diesel generators for backup power and natural gas turbines, which emit NO2, CO, PM2.5 and hydrocarbons (HC), or VOCs in European terminology, during load tests and power supply failures.
A second, less visible risk is indoor air quality; ozone (O3) concentrations exceeding 10 ppb can cause progressive corrosion in copper connectors and circuit boards, a threshold far lower than the 70 ppb limit set for human health.
Air Quality Innovation in Just 1 Click
Stay informed about the air you breathe!
Subscribe to our newsletter to receive the latest updates on environmental monitoring technology, air quality studies, and more.
Meanwhile, the density of these installations across specific geographic areas or data center corridors, such as Loudoun County in Virginia, USA (one of the world’s largest concentrations), amplifies the cumulative impact of these emissions. This is why organisations such as the Virginia Department of Environmental Quality (DEQ), with EPA funding, are already deploying sensor networks to characterise atmospheric emissionsAtmospheric emissions are pollutants emitted into the air, mainly as a result of human activities such as industry, transport by combustion vehicles and en...
Read more and the environmental footprint of this industrial sector to control pollution and protect neighbouring communities.
Data centers have become critical global infrastructure. In November 2025, the United States alone operated 5,427 active data centers, and the number of hyperscale or massive computing installations worldwide exceeded 1,297 units by the end of 2025, having doubled in the past five years, according to Synergy Research Group. Demand for computing power for artificial intelligence, cloud services and digital platforms acts as an accelerator, and the growth trend shows no signs of slowing.
However, the emissions associated with this infrastructure do not follow the pattern of a traditional industry. They are intermittent (generators only operate during load tests or power supply failures), diffuse (distributed across cooling equipment, generator sets and construction machinery) and multisource. This combination makes them harder to characterise and, until very recently, less regulated than other industrial activities with equivalent impact.
Three factors have turned environmental monitoring of data centers into an inescapable priority:
- Growing regulatory pressure. In the USA, the Virginia Department of Environmental Quality (DEQ) launched in February 2026 the Phase I of its Data Center Air Monitoring Project, funded by the EPA, deploying real-time sensors in Loudoun County’s “Data center Alley” to measure CO, NO2 and PM2.5. In Europe, environmental reporting requirements are progressively tightening under the framework of the corporate sustainability reporting directive (CSRD).
- Demand for community transparency. Neighbouring communities are demanding access to objective data about the air quality they breathe. This is not a vague demand; for instance, it is precisely why Virginia’s DEQ has initiated this project for regulation.
- Internal operational risk. This is the least visible vector and, paradoxically, the most costly. Ozone concentrations above 10 ppb or elevated levels of hydrogen sulphide can initiate corrosion processes in copper and silver connectors that degrade hardware progressively. The ANSI/ISA-71.04-2013 standard classifies corrosive environment severity into four levels (G1 to G4), and recommends the use of real-time corrosion sensors (copper and silver coupons exposed to the environment) to monitor air reactivity before damage becomes irreversible.
Models project that by the end of the decade, data centers in the USA could be responsible for approximately 1,300 premature deaths annually and up to 600,000 cases of asthma symptoms annually, with an estimated public health cost of around 20 billion dollars per year. Guidi, G. et al. (2026).
The main parameters to control in these installations span both external and internal contaminants:
| Parameter | Relevance in data centers |
| NO2 | Emitted by diesel generators and gas turbines during tests and emergencies. |
| CO | Indicator of incomplete combustion in generator sets. |
| PM2.5 / PM10 | Generated during construction phase; risk to neighbouring communities. |
| O3 (ozone) | Above 10 ppb, corrodes copper connectors and circuit boards. |
| H2S and sulphur compounds | Accelerate corrosion of metal contacts in server rooms. |
| VOCs (volatile organic compounds) | Present in emissions from generators and construction materials. |
| Air corrosivity (Cu/Ag) | Classification G1–G4 according to ISA-71.04; requires real-time metal coupon sensors. |
This article covers comprehensively all applications of air quality monitoring in data centers. From the external perimeter and construction phase to server rooms, including the criteria for selecting appropriate sensors for each use case. The ultimate aim is to provide environmental managers, operations directors and maintenance engineers of these facilities with the technical criteria needed to make informed decisions.
What real impact do these installations have on air quality in neighbouring communities?

Environmental monitoring programmes in data centers rarely focus on monitoring a single pollutant.
Why data centers raise air quality concerns
A data center does not pollute like a factory. It has no permanent chimney, does not emit continuously and predictably, and does not fit easily into regulatory frameworks designed for traditional industry. That is, precisely, the root of the problem. The emissions from a data center are harder to characterise, and until now this difficulty has translated into weaker regulatory pressure.
Three sources and three emission profiles
Monitoring emissions in data centers must simultaneously consider multiple sources that exhibit very different temporal behaviours:
- Diesel generators and natural gas turbines for backup power. These are the most intense emission source. They operate during load tests (typically monthly or quarterly) and during power supply failures. During these intervals, they emit concentrated pulses of NOx, CO, PM2.5 and hydrocarbons. Atmospheric pollution from diesel generators in data centers is the vector attracting the most regulatory attention, precisely because these emissions are intermittent, difficult to anticipate and of high environmental impact.
- Cooling systems and auxiliary equipment. These operate continuously. Their emissions are lower in intensity, but constant. In large-scale installations, the sustained accumulation of these emissions (especially in indoor spaces) can reach thresholds relevant to hardware integrity.
- Construction activity. This is a temporary phase, but of high local impact. Heavy machinery generates PM10 and PM2.5 dust affecting neighbouring communities, and its NO2 and NOx emissions can extend beyond the construction site perimeter for months or years, particularly in successive expansion projects.
The challenge of geographic concentration of data centers
None of these sources is particularly problematic to address in isolation. The real challenge emerges when they are considered together and, especially, when they multiply across the same geographic corridor.
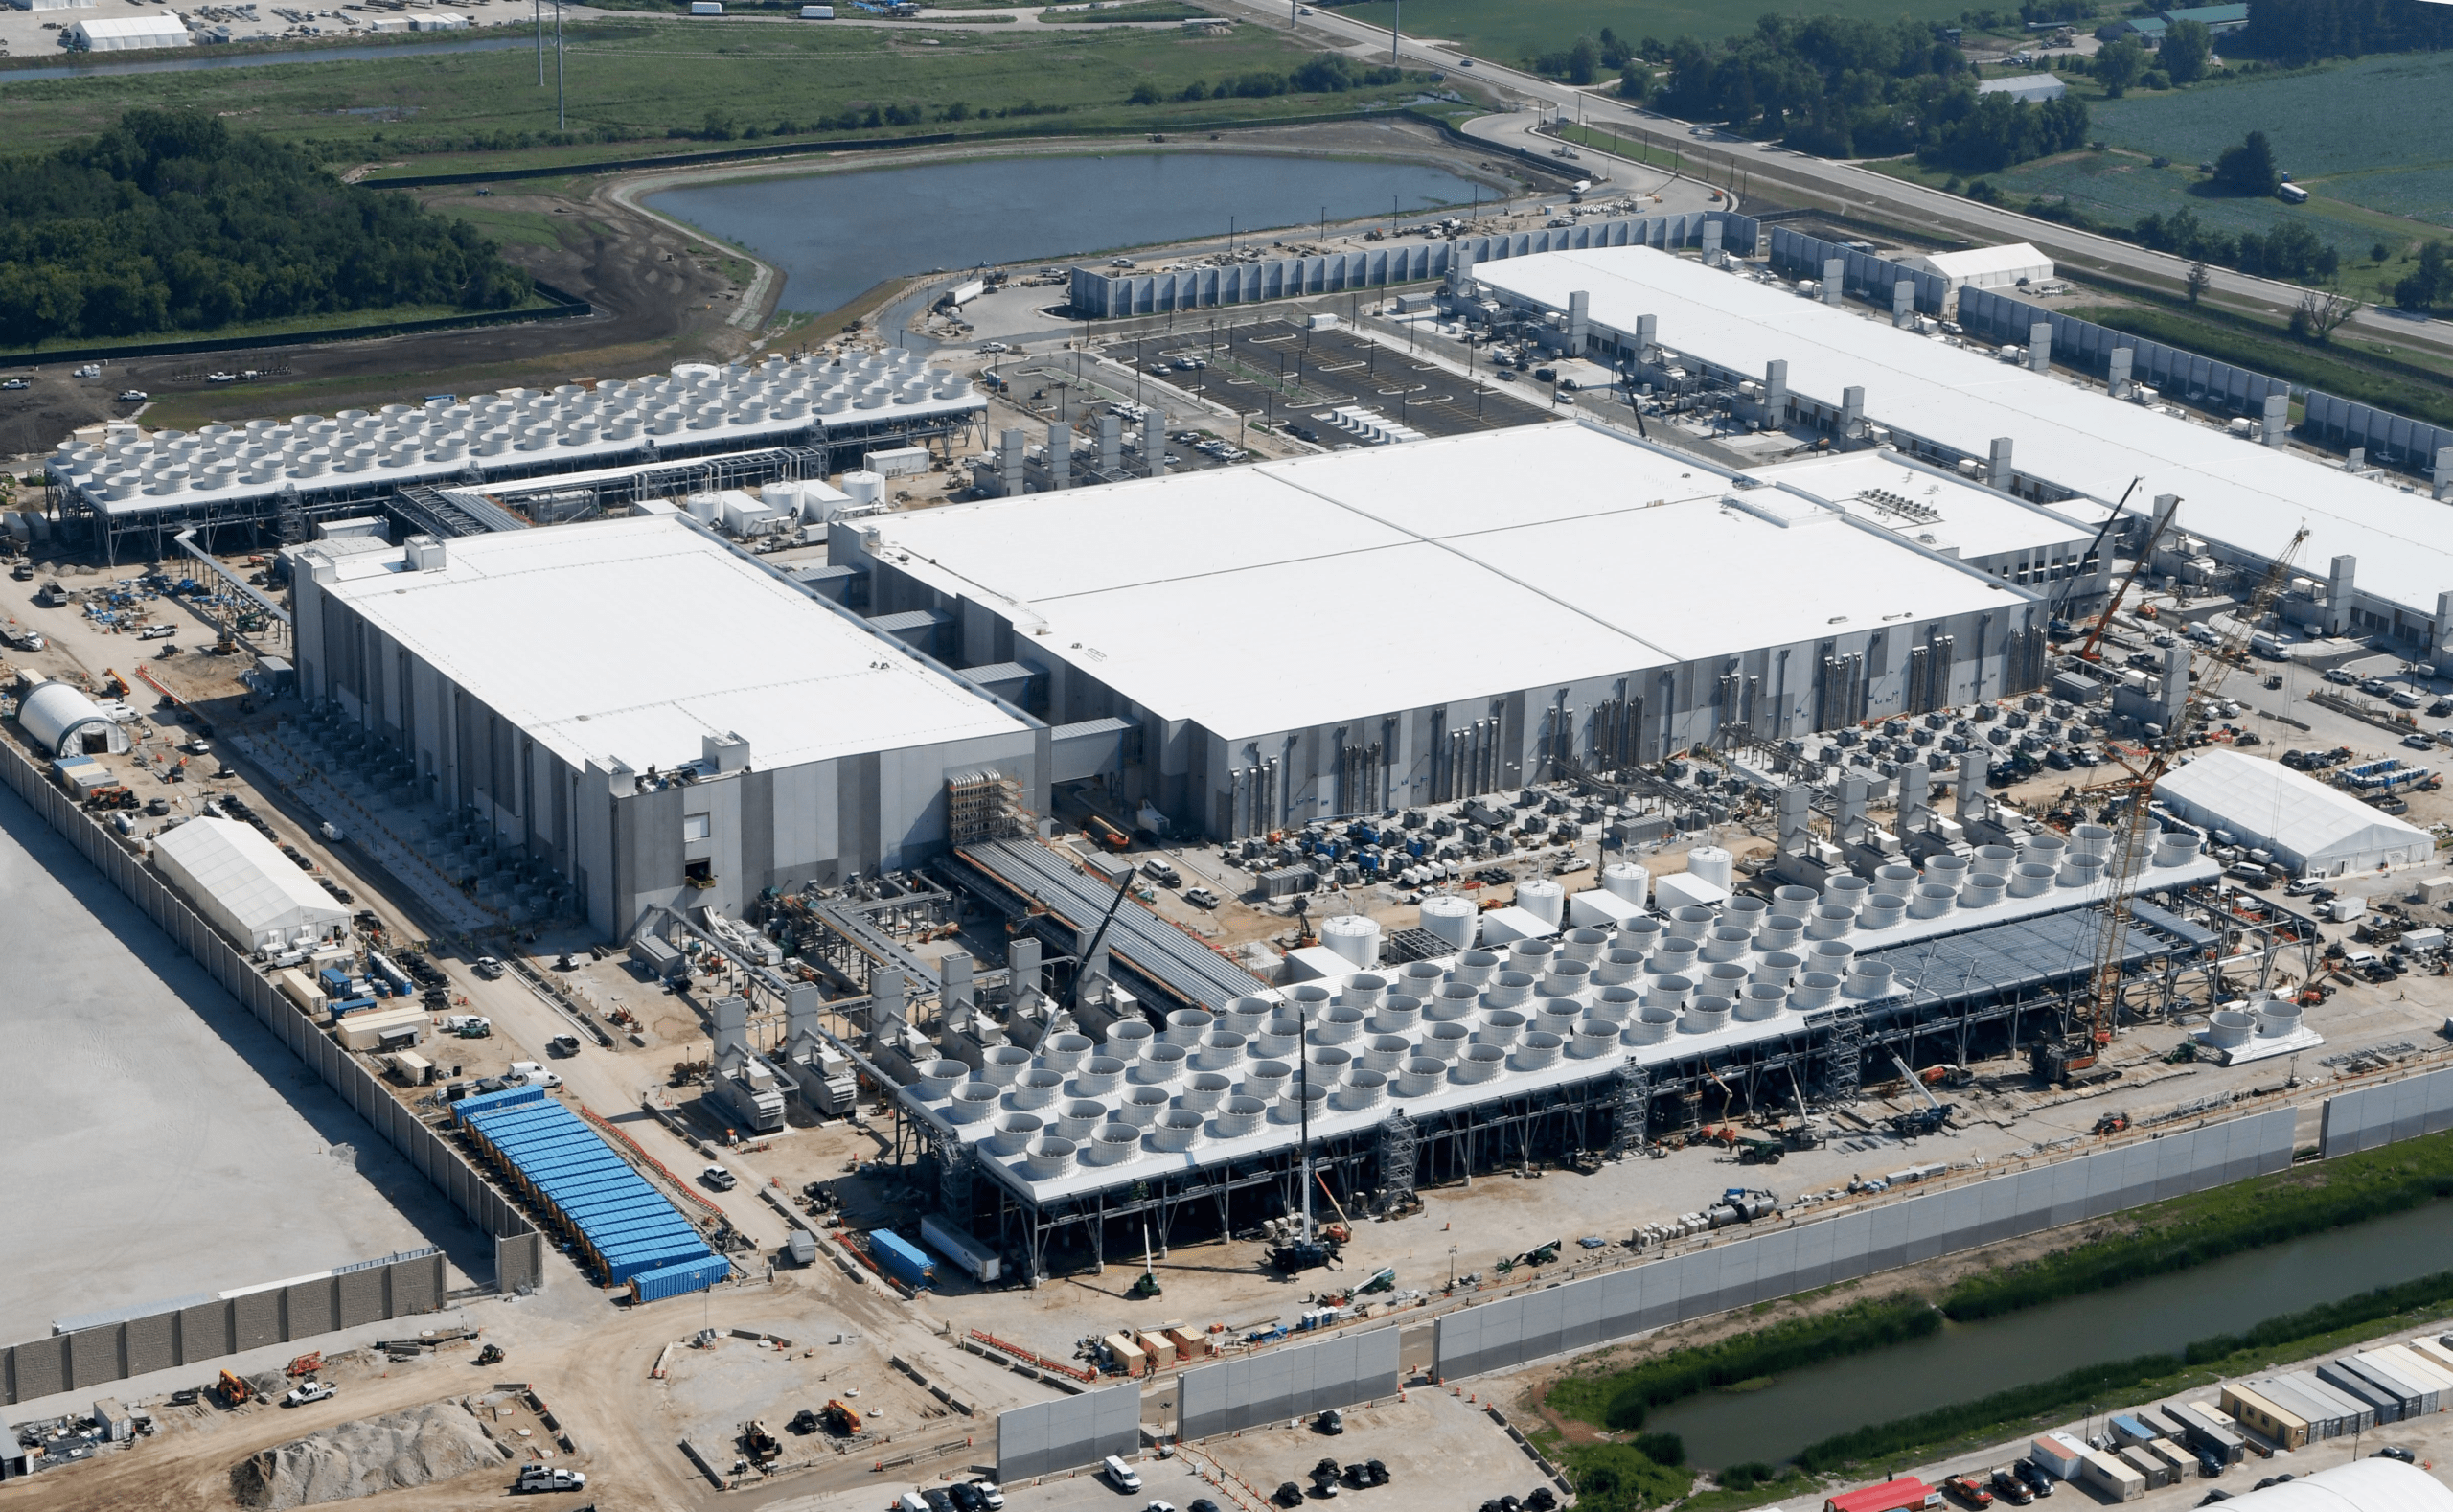
In Loudoun County (Virginia), dozens of data center installations operate across a confined area. No individual operator monitors the cumulative impact of their generators on the ambient air quality; each manages its own load tests, its own power failures, its own construction phase. The result is a collective environmental footprint that can only be assessed with large-scale sensor networks, like those the Virginia DEQ has begun deploying with EPA funding. This same cumulative impact pattern is being replicated across emerging data center corridors such as Madrid Digital Hub and Zaragoza and surrounding areas in Spain, the Greater Jakarta area in Indonesia, Malaysia’s 177 data centers operated by 64 providers, and other areas worldwide with high density digital infrastructure.
The two dimensions of data center environmental risk
The environmental problem created by data centers has two aspects, and both require distinct monitoring strategies:
- External dimension: impact on neighbouring communities and compliance with environmental regulation. This is the most visible dimension and generates the greatest regulatory and social pressure.
- Internal dimension: pollutants do not only leave the data center, they also enter it. Ozone, hydrogen sulphide and airborne particles in indoor air can progressively degrade metal connectors and circuit boards. This operational risk (silent, cumulative and costly) is the one most frequently underestimated.
Data center operators increasingly face the requirement to demonstrate they comply with current regulations using verifiable, real-time and publicly accessible data.
Application 1: monitoring emissions from backup generators
A data center does not pollute continuously. It pollutes in bursts. And those bursts have a name, a time and a cause: they are the periodic load tests of diesel generators and natural gas turbines for backup power, and unplanned electrical supply failures. This intermittency is precisely what makes atmospheric pollution monitoring from diesel generators in data centers both technically a demanding mission and, simultaneously, relevant at regulatory level.
A medium-sized data center may operate between 10 and 30 backup generators. In high-density corridors, the number of units that can start simultaneously during a coordinated test or regional outage easily exceeds 100–200 units within a few kilometres. No individual operator has visibility over the cumulative impact of that event on ambient air quality.
Load tests are mandatory to ensure operational reliability of the installation. This process has an important consequence for data center monitoring because these emissions are predictable in time. An operator knows when their generators will start. This makes periodic tests the easiest event to correlate with ambient air quality data and the natural starting point for any emissions monitoring programme in data centers.
Priority contaminants and regulatory limits for backup generators
Diesel generators and gas turbines emit a well-characterised contaminant profile. These are the priority parameters for air quality monitoring in data centers:
| Contaminant | Primary effects | NAAQS limit (USA) | EU limit (Directive 2024/2025) |
| NO2 | Precursor to tropospheric ozone and photochemical smogSmog, beyond that dense fog Smog is a mixture of air pollutantsAir pollution caused by atmospheric contaminants is one of the most critical and complex environmental problems we face today, both because of its global r... Read more that accumulate in the atmosphere, especially in urban areas. This phenomenon is characteri... Read more. |
100 ppb (hourly average, 98th percentile annual). | 200 µg/m3 (hourly average). |
| PM2.5 | Respiratory and cardiovascular impact. | 35.0 µg/m3 (24-hour average, 98th percentile). | 10 µg/m3 (annual average, 2030 target). |
| CO | Indicator of incomplete combustion. | 35 ppm (hourly average). | – |
| HC / VOCs | Ozone precursors; cumulative impact. | No direct NAAQS limit in ambient air. | – |
Hydrocarbons have no direct regulatory limit in ambient air under NAAQS standards, but are relevant in cumulative impact assessments, particularly when multiple installations operate in proximity.
Recommended monitoring strategy for backup generators
The design of the monitoring network for data centers must address two simultaneous objectives: detect the external footprint of emissions and be able to attribute it to specific operational events.
To achieve this, it is recommended to establish the following monitoring strategy:
- Perimetral network with downwind sensors. Placing sensors on the installation perimeter and in residential areas downwind allows detection of NO2, CO and PM2.5 peaks generated during load tests and correlation with generator operation logs. This correlation is the data environmental authorities are beginning to require.
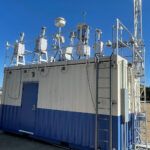
- Co-location with regulatory reference stations. When a regulatory monitoring station exists in the area of influence, co-locating a low-cost sensor next to it enables cross-validation of data and strengthens the credibility of the monitoring programme before authorities. This is precisely the approach adopted in the Virginia DEQ project, where one of the Kunak AIR Pro sensors has been deployed alongside the regulatory station in Ashburn to validate measurements in Loudoun County’s data center corridor.
The starting point was citizen concerns about emissions from backup generators and natural gas turbines operating in these complexes, many of which concentrate dozens of installations across a confined geographic area.
- Real-time data transmission with configurable alerts. The ability to detect emission episodes outside expected range without waiting for inspection campaigns to close is an operational requirement, not an add-on. It enables the operator to act (and document that action) before the incident becomes a regulatory notification.
Minimum recommended parameters to detect:
| Priority | Parameter | Justification |
| Minimum | NO2, CO, PM2.5 | Contaminants with direct regulatory limits and highest public health impact. |
| Recommended | Total NOx | To evaluate NO/NO2 ratio and ozone formation potential. |
| Profile-dependent | SO2 | In diesel generators using high-sulphur fuel. |
| Profile-dependent | HC / VOCs | In facilities with cumulative impact assessments or voluntary reporting requirements. |
Ozone sources inside data centers are not obvious, but all are preventable with proper air quality monitoring.
Application 2: indoor air quality and ozone control
Indoor ozone is an air quality problem in data centers that does not appear in environmental reports from neighbouring communities, generates no neighbourhood complaints and triggers no regulatory alert. Yet it can cost millions of euros in degraded hardware before detection.
Ozone is a powerful oxidant which, at elevated indoor concentrations, does not attack the lungs but rather copper. It degrades metal connectors, oxidises contact surfaces on circuit boards and accelerates the ageing of critical data center components progressively and invisibly.
Graedel, Franey and Kammlott (1983) demonstrated at Bell Labs that atmospheric H2S and SO2 are the primary agents of copper corrosion in electronic environments, establishing that the rate of degradation is proportional to contaminant concentration and exposure time, and that humidity acts as an accelerator of the process.
This damage mechanism is documented and quantified in the ANSI/ISA-71.04-2013 standard (Environmental Conditions for Process Measurement and Control Systems: Airborne Contaminants), the technical reference for the industry on contaminants in industrial electronics environments.
The key data point for this application is that the damage threshold for hardware is far lower than the regulatory limit for human health. ISA-71.04 establishes severity level G1 (onset of risk for sensitive electronic equipment) at 10 ppb O3. The NAAQS limit for human health is 70 ppb averaged over 8 hours. This means a server room can be perfectly within legal limits for people whilst simultaneously causing cumulative hardware damage.
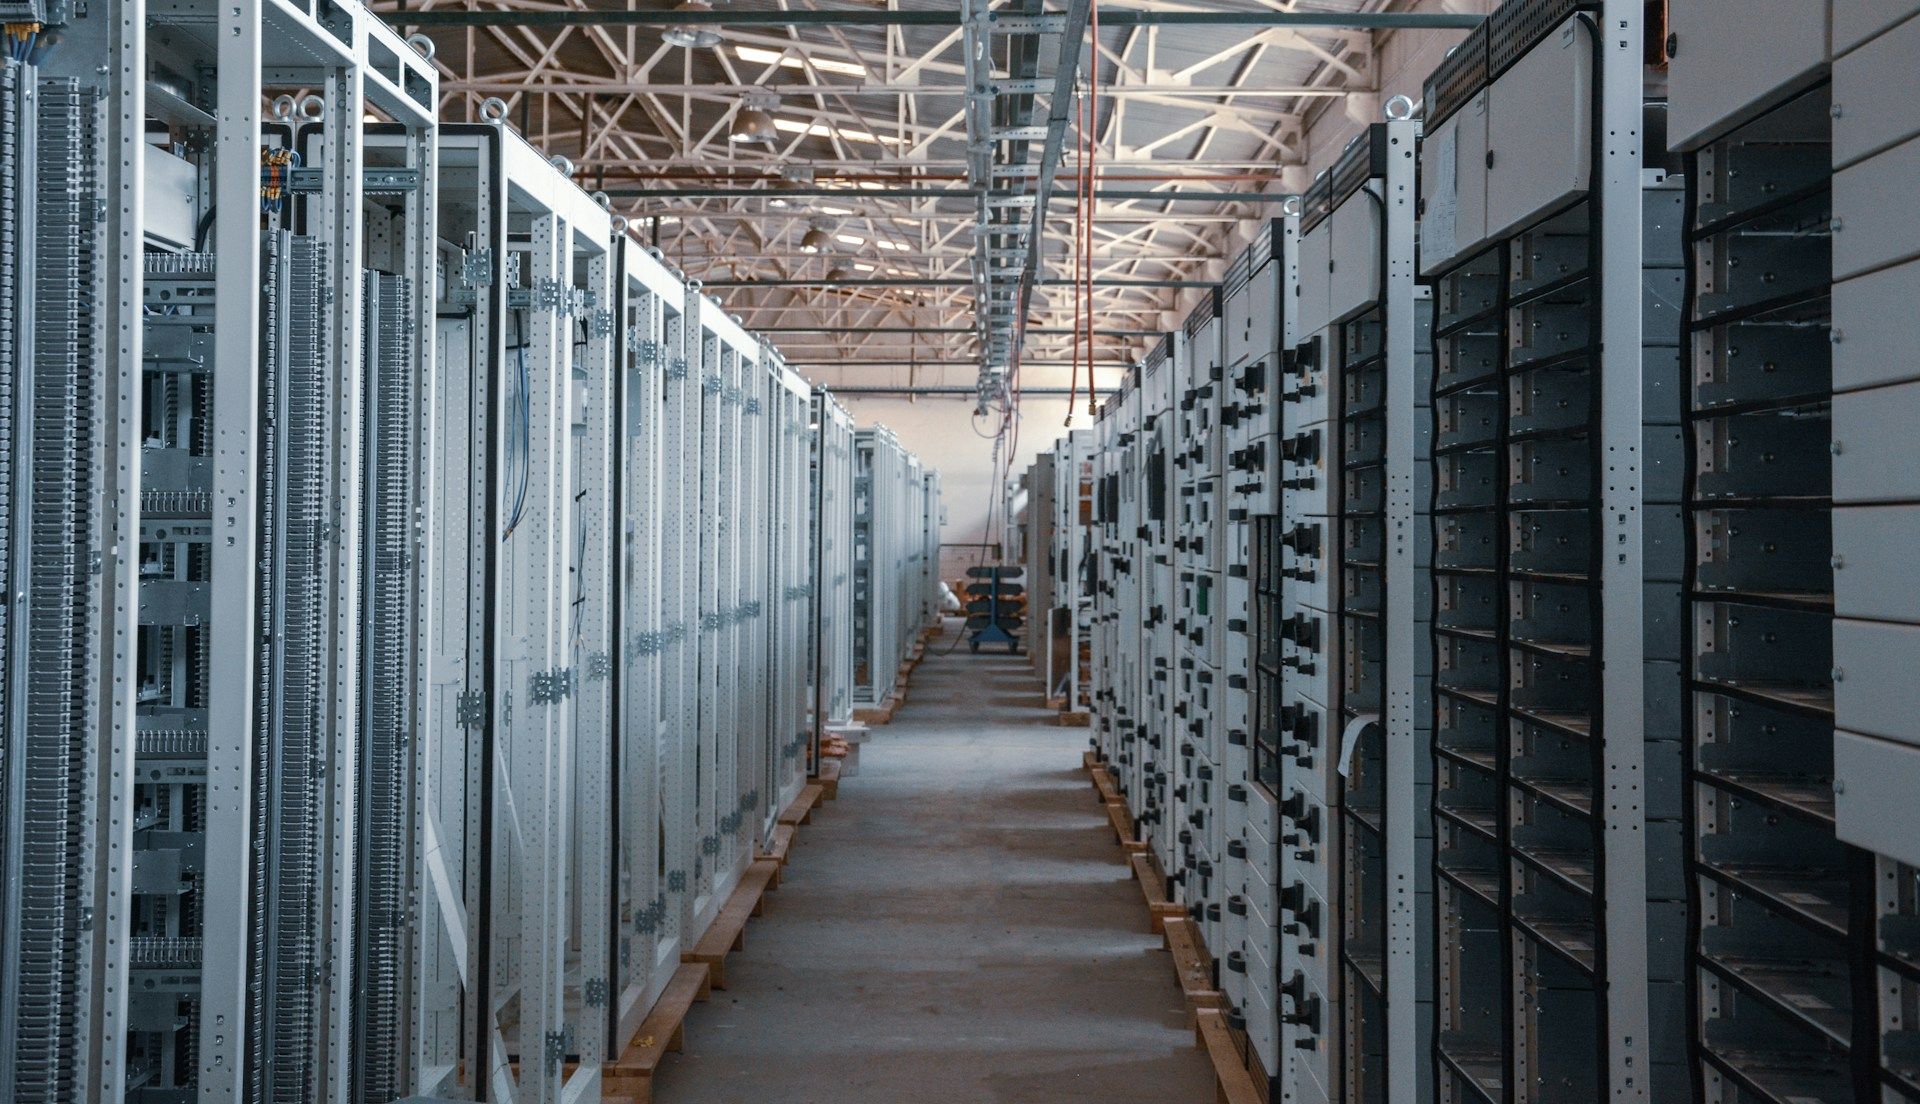
Indoor ozone sources are more diverse than they appear. From infiltration from outdoors during urban smog episodes, poorly calibrated air purification systems, laser printers and office equipment in adjacent areas, and electrostatic discharge in high-voltage equipment. None of these indoor ozone sources is obvious. But all are preventable with monitoring.
Other priority contaminants for indoor air quality
Other gaseous contaminants that degrade hardware and determine the severity of the corrosive environment, as well as the final classification of the environment are:
- H2S (hydrogen sulphide) and SO2 (sulphur dioxide): highly corrosive to copper and silver contacts. Their sources in a data center are not internal; they come from external industrial emissions infiltrating through air intake systems, certain building materials or cooling equipment. Concentrations of only a few ppb are sufficient to initiate corrosion processes in sensitive electronics environments.
- Ultrafine particlesAt first glance, the air around us may seem clean, but beware, it hides an almost imperceptible danger: ultrafine particles (UFP). With a size so small the...
Read more (PM1): capable of depositing on electronic components and causing short circuits or thermal degradation. Particularly relevant in installations near high-traffic motorways or industrial activity. - Relative humidity and temperature: not contaminants in the strict sense, but their interaction with H2S and SO2, in the presence of moisture, accelerates electrochemical corrosion processes significantly. Their continuous monitoring is an essential complement in any ozone monitoring network in data centers.
In these applications, metal coupon corrosion sensors (equipped with thin copper and silver coupons exposed to the environment) in real-time provide the data for classification of the corrosive environment according to ISA-71.04 recommendations.
These sensors do not measure the point concentration of a specific gas; they measure the cumulative effect of all corrosive contaminants present on a reference metal surface, and allow classification of the environment into levels G1 (mild), G2 (moderate), G3 (severe) and G4 (very severe).
This way, a measurement is obtained that is directly oriented to operational risk. It does not report how much ozone is in the air, but how much is already corroding the environment. For a facilities manager, that difference is fundamental.
Recommended monitoring strategy for indoor air quality and ozone control
In this application, the recommended monitoring strategy is for the network design to cover both the interior of server rooms and external air intake points:
- Sensors in server rooms and CRAC/CRAH units: monitoring in precision air conditioning systems allows detection of external contaminant infiltration before reaching critical equipment, acting as a first line of alert.
- Integration with the BMS (Building Management System): connecting sensors to the building management system enables automatic activation of additional filtration protocols or operational alerts when ISA-71.04 thresholds are exceeded, without relying on periodic manual reviews.
“Real-time corrosion monitoring for copper and silver reactivity measures air contamination levels according to ISA-71.04-2013 standard.” ASHRAE Indonesia (2024).
Minimum recommended parameters for this application:
| Priority | Parameter | Justification |
| Minimum | O3, H2S, SO2 | Contaminants with hardware damage threshold below human health limits. |
| Recommended | PM2.5, PM1 | Deposition on components; relevant in high-traffic or industrial exposure zones. |
| Complementary | Temperature, relative humidity | Accelerate corrosion in presence of corrosive gases. |
| Advanced | Cu/Ag reactivity sensor | G1–G4 classification according to ISA-71.04; direct operational risk metric. |

Data center corridor in Loudoun County, Virginia, USA.
Application 3: monitoring during construction phase
Building a large data center is not merely an engineering project. It is a source of emissions with a definite start and end date and, simultaneously, with very specific impact on communities living around the data center site. During 18 to 36 months, there will be massive earth movements, demolition, heavy traffic of machinery and activities of cutting and drilling that generate dust, gases and noiseImagine waking up every morning at 5:00 a.m. to the relentless roar of a motorway just metres from your window. Experiencing such high-intensity noise is n...
Read more continuously. The problem is not that these emissions are especially toxic; it is that they are sustained, predictable and, in many cases, perfectly preventable with real-time monitoring.
Priority contaminants and regulatory limits during data center construction phase
Dust monitoring on construction sites for data centers follows a specific regulatory framework, distinct from center operation:
In Spain, Law 21/2013 on Environmental Assessment establishes the obligation to submit large-scale data center projects to Environmental Impact Assessment (EIA) before authorisation. Depending on project size and the autonomous community, the procedure may include an Environmental Surveillance Programme on-site with specific measures for controlling dust and gas emissions. Each autonomous community may add additional requirements to those established in the aforementioned law.
In the USA, regulatory control is distributed between the federal EPA (Clean Air Act, New Source Review NSR, National Emission Standards for Hazardous Air Pollutant NESHAP) and agencies such as Virginia’s DEQ, which issues specific air permits for data centers and publishes an updated list of issued permits, and the CARB (California Air Resources Board). Additionally, several states have their own active programmes for data centers such as the Washington State Department of Ecology, which issues construction permits for data centers, requires health impact assessments for toxic air contaminants (diesel and NO2) and monitors the cumulative impact of generators in areas like Quincy and Wenatchee. Even local air quality agencies in each county can establish specific regulatory control for this type of installation.
In emerging Asian markets, where local regulation is still less consolidated, pressure to adopt equivalent standards comes from international funders (IFC, multilateral development banks) that require compliance with their own environmental performance standards as an essential condition for financing.
To evaluate priority contaminants and their sources, it is important to consider that the emission profile during construction differs from that during operation. Sources are physical and mechanical, not organised combustion:
| Contaminant | Primary source on-site | Relevance |
| PM10 | Earth movements, traffic on unpaved tracks, demolition. | Primary indicator of construction dust; control parameter in environmental management plans. |
| PM2.5 | Material cutting, machinery activity, resuspension of fine dust. | Greater health impact; the parameter of greatest concern to neighbouring communities. |
| NO2 / NOx | Diesel engines of excavators, trucks and cranes. | Relevant on-site with high machinery density or in urban settings where they accumulate with road traffic. |
| CO | Incomplete engine combustion. | Particularly relevant in semi-enclosed spaces: underground garages under construction, interiors during installations phase. |
| Crystalline silica / concrete particles | Cutting, drilling and demolition of building materials. | Risk to worker health and neighbouring communities; requires sensors with fine fractionation (PM1, PM2.5, PM4, PM10). |
Recommended monitoring strategy for data center construction phase
In the recommended monitoring strategy for this application, network design must pursue two simultaneous objectives: protecting communities and protecting the data center developer.
- Perimetral network oriented downwind. Placing sensors at plot boundaries in the direction of nearest residential areas generates the documentary evidence the developer needs before the administration or against potential neighbourhood complaints. Without own real-time data, any PM10 peak recorded by a nearby regulatory station can be attributed to construction work without possibility of refutation.
- Sensors at points of highest internal activity. Monitoring in earth movement zones, truck exits and demolition areas allows identification of major internal contribution sources and activation of immediate corrective measures such as track watering, speed limitation in site roads or load covering. The difference between acting 10 minutes after exceeding a threshold or detecting it the next day in a report can be the difference between meeting the environmental plan or receiving an inspection.
- Configurable alerts by threshold. Real-time data transmission with automatic alerts (configured against environmental management plan limits) places the responsibility for action at the moment the event occurs, not when the weekly report is reviewed.
Minimum recommended parameters to monitor:
- Minimum: PM10, PM2.5, NO2 and CO.
- Recommended: PM1, TSP (Total Suspended Particles), wind speed and direction to establish correlation of peaks with internal sources.
- Sensor operational conditions: minimum IP65 electrical protection rating to operate in a dust-laden environment without internal electronic penetration and to guarantee protection from rain, track watering or hose cleaning without damage to internal components. Additionally, it must have a wide temperature range and solar panel power supply capacity for perimetral locations without available electrical infrastructure.
In general, construction environments are demanding because they contain dust, vibrations, absence of electrical infrastructure at the perimeter and variable weather conditions. An environment for which the Kunak AIR Pro station is designed to ensure these environmental conditions do not compromise data quality.

Inside data centers there are gaseous contaminants like ozone that degrade hardware and determine the severity of the corrosive environment.
Application 4: monitoring data center impact on neighbouring communities
Meeting environmental regulations is no longer sufficient. Data center operators increasingly face an additional requirement to demonstrate compliance using verifiable data, in real-time and publicly accessible. The difference between declaring compliance and proving it is redefining the relationship between this industry and the communities surrounding it.
Citizen opposition to data center development is not a marginal phenomenon. In northern Virginia, communities in Loudoun and Prince William County have directly pressured the DEQ to obtain objective data on air quality in their neighbourhoods. This citizen pressure was one of the factors that prompted the launch of the Data Center Air Monitoring Project in February 2026. With 22 potential monitoring locations explicitly designed to characterise the cumulative impact of the data center corridor on neighbouring communities.
In Spain, the Henares corridor (with active projects from Microsoft, ACS/Iridium and Iron Mountain) in municipalities like Alcalá de Henares, San Fernando de Henares, Torres de la Alameda and Loeches, is experiencing at scale the dynamics of Loudoun County: accelerated growth, ongoing environmental impact assessments and neighbouring communities beginning to demand verifiable data on air quality.
“Air pollution remains the largest environmental risk to health in Europe, causing cardiovascular and respiratory diseases that reduce quality of life and, in the worst cases, lead to preventable deaths.” EEA — Air quality in Europe 2023.
How to design a community-wide air quality monitoring network
The logic for this data center application is opposite to that of indoor applications. The air quality monitoring network is not designed to measure inside the installation, but outside, at receptors that matter to communities such as residential zones, parks, schools and other sensitive areas downwind of installations.
Optimal network design combines two types of locations:
- Upwind points: establish the background pollution level without data center influence. They are the reference data without which no attribution is possible.
- Downwind points: detect the installation’s contribution to air quality in inhabited zones. Comparison between both points allows quantification of real impact, not estimation.
This is exactly the logic Virginia’s DEQ applied in its project, with simultaneous coverage of downwind, upwind and interior positions within the study area. Co-locating at least one sensor next to the nearest regulatory reference station (another key design decision in the DEQ project) enables cross-validation of data and strengthens the credibility of results before administrations and citizens.
Publishing sensor data in real-time through an accessible web portal transforms an air quality sensorMeasuring air quality is essential for improving human and environmental health. Changes in the natural composition of the air we breathe are common in ind...
Read more network for data centers into a public communication tool. Data transparency becomes a governance mechanism whereby any citizen can verify PM2.5, NO2 or CO levels in their neighbourhood without intermediaries, without waiting for annual reports and without need for technical knowledge.
For operators with ESG commitments, this transparency is not just a compliance cost; it is an asset. Traceable and auditable data from a continuous emissions monitoring network for data centers is exactly the type of evidence that corporate sustainability reports and third-party audits require to give credibility to environmental impact statements.
Recommended parameters to control for this application:
| Priority | Parameter | Justification |
| Minimum | PM2.5, NO2, CO | Contaminants with greatest health impact and direct regulatory limits. |
| Recommended | O3, SO2, PM10 | Complete profile of contaminants relevant to neighbouring communities. |
| Complementary | Wind direction and speed | Essential for source attribution analysis and upwind/downwind correlation. |

As data centers increase, they will generate more complex emissions, at more locations and under increasing regulatory and social pressure.
Sensor selection criteria for data center monitoring programmes
Before selecting a sensor for data center monitoring, it is worth considering a fundamental question: what will the data generated be used for? For example, a sensor deployed at the perimeter of a construction site to meet an environmental management plan does not need the same attributes as one located next to a regulatory station to validate data before the competent authority. The criteria followed for each are ordered by the impact they have on data quality and utility of the final measurement, never by equipment cost.
Parameter coverage and multi-parameter architecture
Environmental monitoring programmes in data centers rarely focus on a single contaminant. A programme covering generator emissions and community impact must measure simultaneously NO2, CO, PM2.5 and, depending on the installation, O3, SO2 or H2S. A sensor requiring separate units for each parameter multiplies installation, maintenance and data management costs proportionally to the number of network points.
The architecture of cartridges or interchangeable modules (allowing adaptation of parameter configuration without changing the base unit) is an extraordinary operational advantage for air quality monitoring programmes that evolve over time or need to be reconfigured between construction phase and data center operation.
Technical validation and comparability with reference equipment
In applications with regulatory implications, data is worthless if it is not comparable with that from the official station. This requires that the sensor has been evaluated and validated against reference methods in real field conditions, not just in the laboratory. Relevant certifications and evaluations are:
- MCERTS (Environment Agency, United Kingdom): field performance evaluation for indicating sensors.
- EPA/600/R protocols (USA): set of protocols, metrics and target values published by the EPA to evaluate sensor performance in non-regulatory supplemental monitoring (NSIM) applications. Covers O3 (EPA/600/R-20/279), PM2.5 (EPA/600/R-20/280), NO2, CO and SO2 (EPA/600/R-23/14) and PM10 (EPA/600/R-23/145). The protocols are voluntary and the EPA does not issue a certificate, but provides the most widely used reference framework in the USA for comparing sensors with regulatory monitors.
- CEN/TS 17660 (Europe): CEN technical specification for evaluating the performance of air quality sensors in monitoring applications.
Kunak AIR Pro holds MCERTS certification (CSA MC230418/00) for PM10 and PM2.5 according to the standards of the UK Environment Agency. It also meets Class 1 CEN/TS 17660, a certification required by European air monitoring regulations. All Kunak sensors are calibrated and tested at the factory according to the European CEN/TS 17660 standard and the EPA/600/R protocols, metrics and target values for air sensors. Thus, data quality is always guaranteed.
In Asian markets such as Malaysia or South Korea, where data center infrastructure development advances at an accelerated pace and local regulatory frameworks are still consolidating, KOTITI Grade 1 certification for PM2.5 (issued by the KOTITI Testing & Research Institute in South Korea) acts as a signal of regionally recognised technical quality. It is the functional equivalent, in that geographic area, of what MCERTS represents in the United Kingdom or CEN/TS 17660 in Europe. Kunak AIR Pro holds this certification, facilitating its deployment in monitoring programmes in markets like Indonesia, South Korea or Singapore without need for additional third-party evaluations.
Likewise, within this ecosystem linked to data centers, AQ-SPEC (South Coast AQMD, California) conducts field and laboratory evaluations of sensors using methodology compatible with EPA/600/R Protocols and has evaluated Kunak AIR Pro, achieving outstanding results in international comparisons.
Operational robustness of sensors in data centers
Data center environments, both during construction and operation, are demanding in different but equally important ways. Minimum sensor requirements to guarantee continuity of measurement are:
| Requirement | Recommended minimum | Justification |
| IP rating | IP65 | Dust and water in construction and outdoor environments. |
| Temperature range | –20 °C to 55 °C | Climate variability in outdoor installations. |
Connectivity and data management from sensors
Real-time transmission is a non-negotiable requirement in early warning applications for data centers. Relevant protocols according to deployment scope are based on:
- 4G/LTE or integrated eSIM: for distributed outdoor networks without local network infrastructure.
- Wi-Fi: for dense indoor networks or installations with proprietary connectivity.
- Modbus RTU / OPC-UA: for direct integration with BMS or SCADA systems of the data center.
The data management platform must cover four minimum functions: alert threshold configuration by contaminant and measurement point, generation of exportable reports in standard formats, historical storage with complete traceability and multi-user access with permission management.
Sensor acquisition cost for data centers
Acquisition price is the most visible criterion and frequently the least representative of actual cost. Compact electrochemical and optical sensors have notably lower unit cost than reference analysers, but electrodes, cartridges and optical heads have limited lifespan. In programmes with ten or more measurement points, the accumulated maintenance cost over three to five years can exceed acquisition cost.
Sensor selection criteria must consider the complete lifecycle, from acquisition, installation and periodic calibration to consumable replacement and technical support. A well-designed air quality monitoring programme in data centers with sensors requiring simple maintenance and low consumable costs generates more useful and more reliable data than one with equipment of higher nominal accuracy but frequent data gaps due to lack of maintenance.
Kunak AIR Pro is specifically designed to meet these five criteria in air quality monitoring applications for data centers: interchangeable cartridge architecture for multi-parameter configuration without changing the unit and with replacement for degradation or end-of-life, MCERTS and KOTITI certifications, IP65 rating, operating range of –40 °C to 60 °C, connectivity via eSIM, Wi-Fi or Modbus RTU, and Kunak Cloud platform for data visualisation and analysis with configurable alerts, data traceability module and exportable reports.
This same equipment is currently deployed in the counties of Loudoun and Prince William, in northern Virginia, which host one of the world’s largest concentrations of data centers. The project that will set measurement precedents for data corridors in the USA is being developed under EPA supervision and coordinated by the Virginia Department of Environmental Quality (DEQ).
Real deployment of Kunak AIR Pro in Virginia data center corridor
The question for Virginia Department of Environmental Quality (DEQ) was very straightforward: are the communities of Loudoun and Prince William County exposed to elevated concentrations of CO, NO2 or PM2.5 as a direct consequence of the activity of data centers surrounding them? To find an answer with technical rigour rather than rely on estimates, the environmental agency needed its own continuous data, comparable with its official regulatory network.
The US EPA had selected Kunak AIR Pro as the reference instrument for air quality measurements. Its application in this programme demonstrates that the equipment meets the technical and operational requirements that a US administration demands when data will underpin public policy decisions.
Consequently, the DEQ initiated the project by identifying 22 potential locations in Loudoun County. Locations selected to provide coverage across the area with upwind, downwind and interior positions of the study area. In February 2026, seven Kunak AIR Pro units were deployed; after a seven-day calibration period, data collection commenced in March 2026.
Two of the monitoring network design decisions for data centers deserve particular mention. One unit was placed in co-location with the DEQ reference station in Ashburn (Broad Run High School), enabling direct comparison of sensor data with a regulatory reference instrument and providing technical strength to the results before any review. Another sensor was positioned near Dulles International Airport to cross-reference readings with meteorological data and improve specific attribution of episodes. The ability to equip the Kunak AIR Pro with integrated solar panel has enabled monitoring station installation at points without electrical grid access, a common situation in distributed networks of this scale.
Results appeared quickly and data from the seven sensors deployed in Loudoun County show that concentrations remained within NAAQS limits at all monitored points. Consequently, hourly NO2 concentrations did not exceed 35 ppb (limit: 100 ppb), CO values remained below 2.6 ppm (limit: 35 ppm) and PM2.5 readings never exceeded the threshold of 35.0 µg/m3.
Historical records by location allow the DEQ to identify whether any points have systematically elevated concentrations that might require attention in later phases. Data are published in near real-time with periodic updates via a publicly accessible web portal. This is where any citizen, researcher or administration can view the evolution of PM2.5, NO2 and CO at each location without needing to request access.
In subsequent phases, once Phase I in Loudoun County is complete, the Kunak AIR Pro sensors will move to Prince William County for Phase II development, scheduled for June 2026. Should results from either of the first two phases identify areas with elevated concentrations, the DEQ will activate deployment of a mobile reference monitoring station (Phases III and IV), whose data will determine whether new permanent stations are needed and where they should be located.

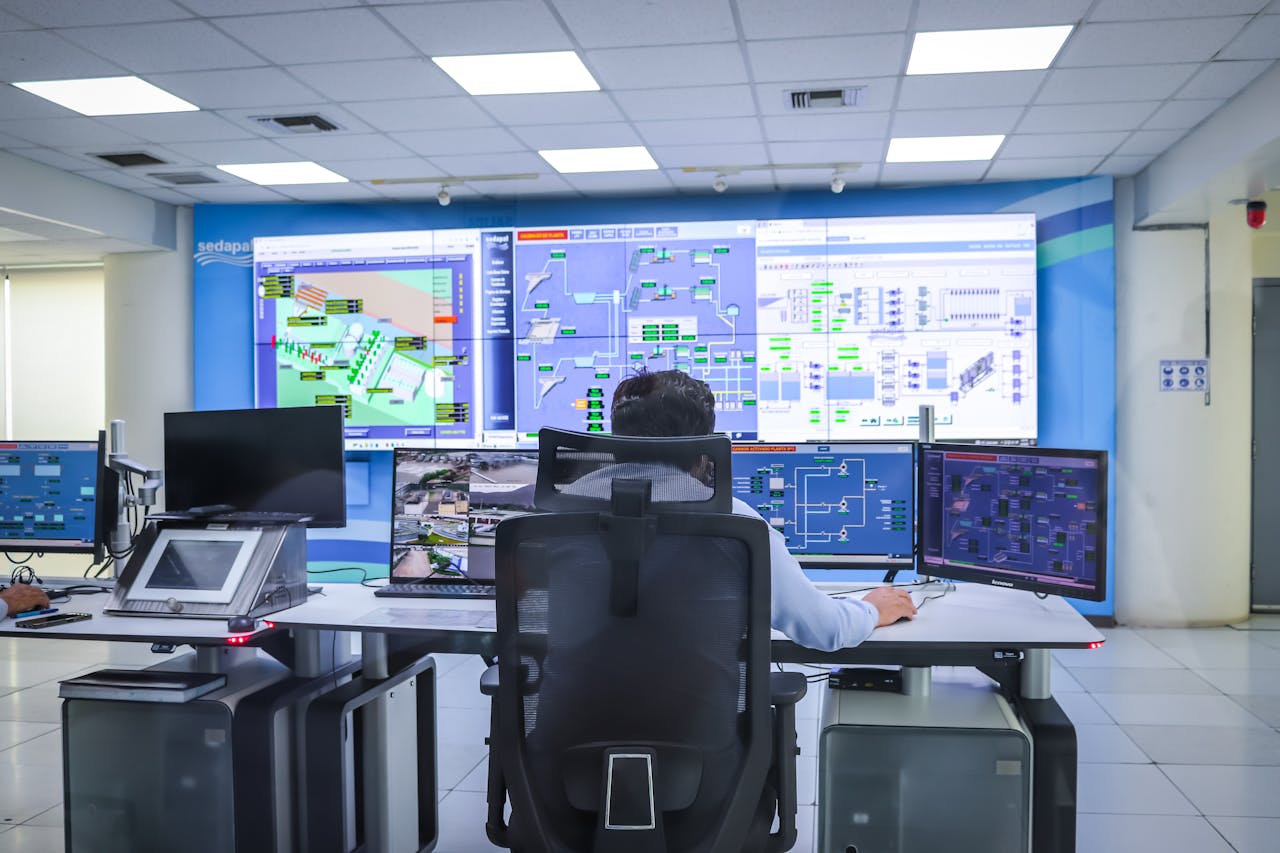
Air quality monitoring network design for data centers detects the external footprint of emissions and links it to specific operational events in facilities.
Conclusion: what data centers measure and what they do not yet
Data centers are not going to generate fewer emissions as their installations grow. Rather, they will generate more complex emissions, at more locations and under increasing regulatory and social pressure. Diesel generators will continue to start during power supply failures, machinery will continue to move earth to build the next digital data center corridors and ozone will continue silently corroding copper connectors in server rooms.
What can change is the capacity to characterise that impact with verifiable, continuous data attributable to specific sources. That capacity, not compliance declaration, is what environmental administrations, neighbouring communities and financial markets are beginning to require as a condition of operation. A well-designed data center monitoring programme is not a compliance cost; it is the data infrastructure that makes it possible to manage, demonstrate and improve the environmental performance of a data center installation throughout its entire lifecycle.
References
- Pitt, D., Suen, E., & Plisko, E. (2026). Localized Air Pollution Impacts from Data Centers in Northern Virginia. VCU Institute for Sustainable Energy and Environment. https://scholarscompass.vcu.edu/isee_pubs/3/
- Guidi, G. et al. / Harvard HSPH. (2026). Analysing air pollution health and economic risks from AI data centers. https://hsph.harvard.edu/news/analyzing-air-pollution-health-economic-risks-from-ai-data-centers/
- George, B. (2026). Health Consequences of Large Data Centers: Air Pollution, Noise, Water Use, and Environmental JusticeEnvironmental justice on air quality issues is crucial to ensure that all communities, especially those in areas of high traffic and industrial activity, a...
Read more. https://ideas.repec.org/p/osf/socarx/cnwyb_v1.html - Shehabi, A., Newkirk, A., Smith, S. J., Hubbard, A., Lei, N., Siddik, M. A. B., Holecek, B., Koomey, J., Masanet, E., & Sartor, D. (2024). 2024 United States Data Center Energy Usage Report. Lawrence Berkeley National Laboratory. https://doi.org/10.71468/P1WC7Q
- Graedel, T. E., Franey, J. P., & Kammlott, G. W. (1983). The corrosion of copper by atmospheric sulphurous gases. Corrosion Science, 23(11), 1141–1152. https://doi.org/10.1016/0010-938X(83)90043-4
- Shehabi, A., Smith, S. J., Masanet, E., & Koomey, J. (2018). Data center growth in the United States: decoupling the demand for services from electricity use. Environmental Research Letters, 13(12), 124030. https://doi.org/10.1088/1748-9326/aaec9c
- European Environment Agency. (2025). Air quality in Europe 2025. https://www.eea.europa.eu/en/analysis/publications/air-quality-status-report-2025
- Better Data Center Project. (2026). Diesel Generators at Data Centers: Status, Impacts, and Protective Policies. https://betterdatacenterproject.com/wp-content/uploads/2026/03/Diesel-Generators-at-Data-Centers-Status-Impacts-and-Protective-Policies.pdf
- ASHRAE Indonesia Chapter. (2024). Air Quality in Data Centers: People vs. The Machines. https://ashrae.or.id/wp-content/uploads/2024/12/1.-Air-Quality-in-Data-Centers_People-vs-The-Machines.pdf