Nitrogen oxides (NOx) and nitrous oxide (N2O) are key air pollutantsAir pollution caused by atmospheric contaminants is one of the most critical and complex environmental problems we face today, both because of its global r...
Read more affecting air qualityAir quality refers to the state of the air we breathe and its composition in terms of pollutants present in the atmosphere. It is considered good when poll...
Read more and climate across multiple sectors: urban, industrial and agricultural. Generated by vehicle combustion, industrial processes and nitrogen fertilisation, these gases contribute to smogSmog, beyond that dense fog
Smog is a mixture of air pollutants that accumulate in the atmosphere, especially in urban areas. This phenomenon is character...
Read more, the formation of tropospheric ozone and global warming. Advanced monitoring using Kunak sensors, which are certified and near-reference, enables real-time measurement of these pollutants, assessment of policy effectiveness such as Low Emission Zones, ensures regulatory compliance and supports strategic decisions on health protection and environmental sustainability at global level.
The technical interest goes beyond identifying their emission sources. Measuring NOx helps understand how urban pollution episodes evolve, which areas experience greater exposure and how traffic, industrial activity and meteorology influence the formation of tropospheric ozone (O3)Tropospheric ozone (O3) or ground-level ozone is a gas found in the lowest layer of the Earth's atmosphere, the troposphere, which extends up to 10 kilomet...
Read more. In the case of N2O, monitoring is particularly relevant in agriculture, waste management and industrial processes, where small variations can have considerable climate weight. This is why having continuous and reliable data allows moving from general diagnosis to concrete decisions; to adjust mobility measures, evaluate emissions reduction strategies, locate persistent sources and document progress with traceable information.
The impact of NOx and N2O is not limited to what we breathe today alone, as it shapes the climate stability that future generations will inherit.
The real scope of their environmental impact elevates them to urgency when they exceed established limits. During 2025, it was confirmed that all major Spanish cities had exceeded the new annual nitrogen dioxide limit set by the EU for 2030 (20 µg/m3), with Madrid, Málaga and Granada leading the list. That same year, a UN report warned that N2O emissions (driven primarily by massive use of nitrogen fertilisers in agriculture) now constitute the greatest active threat to the stratospheric ozone layer and that ambitious reductions could prevent up to 20 million premature deaths before 2050.
The problem is not exclusive to Spain. Cities such as London, Paris, Milan, Mexico City and Beijing have had to implement specific measures to reduce NO2 concentrations associated with traffic and industrial activity. In parallel, agricultural regions in the United States, China, Brazil and India have become significant sources of N2O emissions due to intensive use of nitrogen fertilisers. These examples show that nitrogen oxides and nitrous oxide are a global challenge requiring monitoring strategies adapted to both urban, agricultural and industrial environments.
A single underlying problem that runs through this article. What these gases are exactly and how they behave in the atmosphere; where they come from and in which sectors their presence is most critical; what effects they have on human health and the environment; and what monitoring tools (from professional certified sensor networks to real-time analysis platforms) today allow us to measure them, control them and convert that knowledge into decisions that make a difference in protecting health and promoting a sustainable environment globally.

NOx and N2O have very different origins depending on the industrial sector where they are generated, which means their control requires equally differentiated strategies.
What are nitrogen oxides (NOx) and nitrous oxide (N2O)
The term NOx groups several gaseous compounds formed by the combination of nitrogen and oxygen molecules, but in air quality practice the main players are two: nitric oxide (NO)Nitric oxide (NO) is one of the most important, and often underestimated, gases in the field of air quality and industrial emissions management. Colourless...
Read more and nitrogen dioxide (NO2)Nitrogen dioxide (NO2) is a harmful gas whose presence in the atmosphere is mainly due to the use of fossil fuels in combustion vehicles and industrial act...
Read more. The former is colourless and odourless; the latter is a brown-reddish gas with a strong odour that becomes visible to the naked eye when it accumulates over cities as a haze with those characteristic shades.
Air Quality Innovation in Just 1 Click
Stay informed about the air you breathe!
Subscribe to our newsletter to receive the latest updates on environmental monitoring technology, air quality studies, and more.
Nitrous oxide (N2O), by contrast, is a different compound. Although it is also colourless and odourless, its more stable molecular structure, combined with its primarily agricultural origin, places it in a separate category within the atmospheric nitrogen family. It differs fundamentally from NO and NO2 in that whilst these act mainly on an urban and tropospheric scale, N2O rises intact to the stratosphere, where it accumulates its damage as a greenhouse gas for over a century.

Nitrogen oxides (NOx) and nitrous oxide (N2O) generated by vehicle combustion, industrial processes and nitrogen fertilisation contribute to smog, the formation of tropospheric ozone and global warming.
Where NOx and N2O come from and how they transform
Nitrogen monoxide (NO) is the gas that is emitted first. In any high-temperature combustion process (a diesel engine, an industrial boiler, a power station) the nitrogen in the air oxidises and escapes to the environment as NO. Once in the atmosphere, that NO oxidises rapidly and converts to NO2. For example, in the exhaust pipe the proportion is approximately 90% NO and 10% NO2, but after a few hours in the presence of sunlight and volatile organic compounds, the equilibrium reverses. It is that reactivity that makes NO2 the reference pollutant for monitoring urban traffic. We are dealing with a process where it is more important to monitor the transformed gas than the emitted gas.
N2O, however, follows a different route. Its formation is primarily microbial in origin. Soil bacteria decompose nitrates from synthetic fertilisers and organic matter, releasing N2O to the atmosphere. The result is a long-lived gas (it remains in the atmosphere for between 110 and 120 years) that rises slowly to the stratosphere without having degraded.
The role of NOx and N2O in smog formation, tropospheric ozone and the greenhouse effect
NOx are the invisible architects of photochemical smog. When NO2 is exposed to sunlight, it dissociates and releases atomic oxygen which reacts with atmospheric O2 to form tropospheric ozone (O3). This ozone, far from protecting as stratospheric ozone does, is a highly oxidant secondary pollutant that damages lung tissues, harms vegetation and is the main component of the toxic haze characteristic of large cities. The environmental reaction does not stop there. NO2 also forms nitric acid, acid rain and secondary particles that worsen overall pollution.
N2O for its part is the third most potent greenhouse gas after carbon dioxide (CO2)Carbon dioxide (CO2) is a gas that occurs naturally in the atmosphere and plays a crucial role in the life processes of the planet. This gas, also known as...
Read more and methane (CH4)Methane, known chemically as CH4, is a gas that is harmful to the atmosphere and to living beings because it has a high heat-trapping capacity. For this ...
Read more, with a global warming potential approximately 273 times higher than CO2 over a 100-year horizon. Furthermore, as it rises to the stratosphere, it destroys stratospheric ozone that protects us from ultraviolet radiation, becoming the most damaging substance to the ozone layer currently being emitted globally. This is how we find ourselves facing two threats in a single chemical compound that drives warming from below and degrades the ultraviolet protection shield of the stratospheric ozone from above.
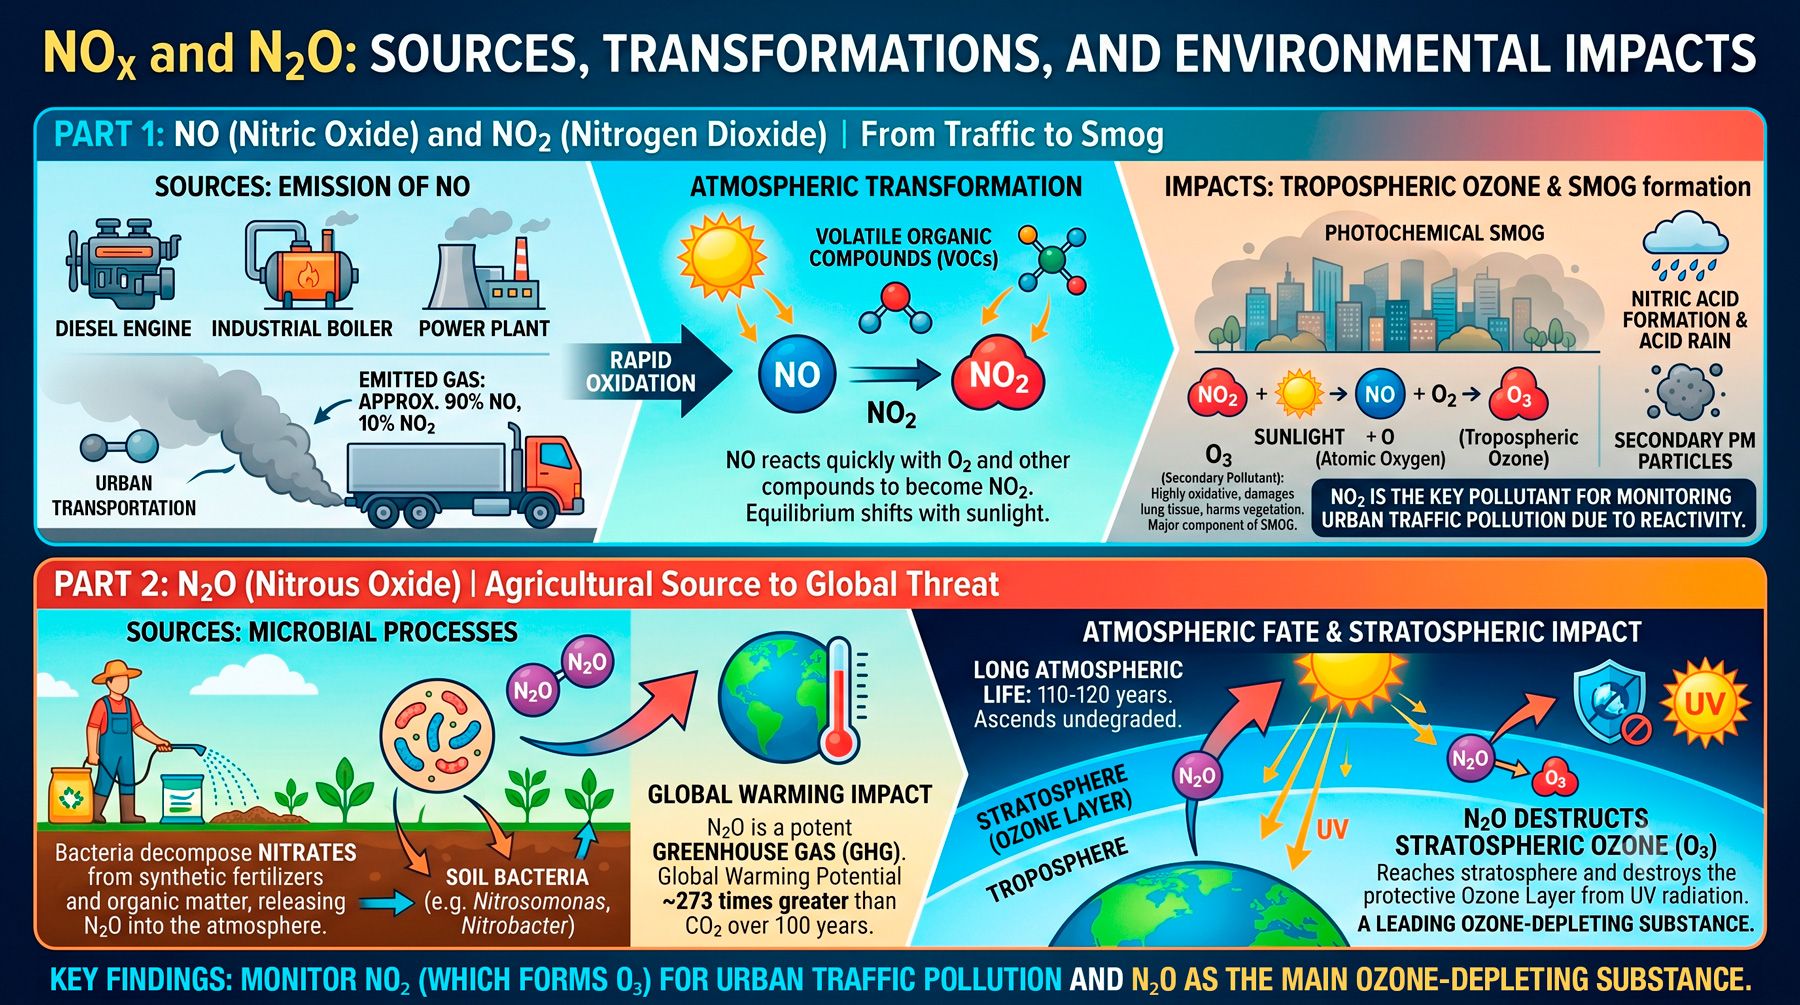
Infographic: Sources, transformations and environmental impacts of NOx and N2O
Main sources of NOx and N2O
Just as there is no single polluting chimney, there is no single guilty gas. NOx and N2O have very different origins depending on the industrial sector where they are generated, which means their control requires equally differentiated strategies. Understanding where each of these air pollutants comes from is the first step in measuring them accurately and taking the necessary steps to reduce their presence effectively.

Nitrogen monoxide (NO) is the gas that is emitted first. In any high-temperature combustion process (a diesel engine, an industrial boiler, a power station) the nitrogen in the air oxidises and escapes to the environment as NO. Once in the atmosphere, that NO oxidises rapidly and converts to NO2.
Urban sectors
Road traffic is the predominant source of NOx in cities. Given that vehicles emit gases near ground level and in densely populated cities, their real contribution to the NO2 pollution levels we breathe is much greater than their local percentage of emissions.
Diesel engines are the main emitters, although petrol vehicles, motorcycles and urban heavy transport also contribute significantly to their environmental concentration. The dynamic for their generation is especially intense during peak hours, when the accumulation of NO on congested roads and its rapid conversion to NO2 in the presence of sunlight generates pollution peaks that trigger alerts in monitoring networks.
Residential and commercial heating adds a second layer of emission that is often underestimated. Boilers burning natural gas, heating oil and biomass generate NOx during combustion, particularly in winter months, when thermal demand coincides with meteorological conditions of low dispersion (thermal inversions and light winds) that trap pollutants near ground level.
The combination of traffic and heating is, in fact, directly responsible for the majority of air quality limit breaches in European cities.
Industrial sector and energy generation
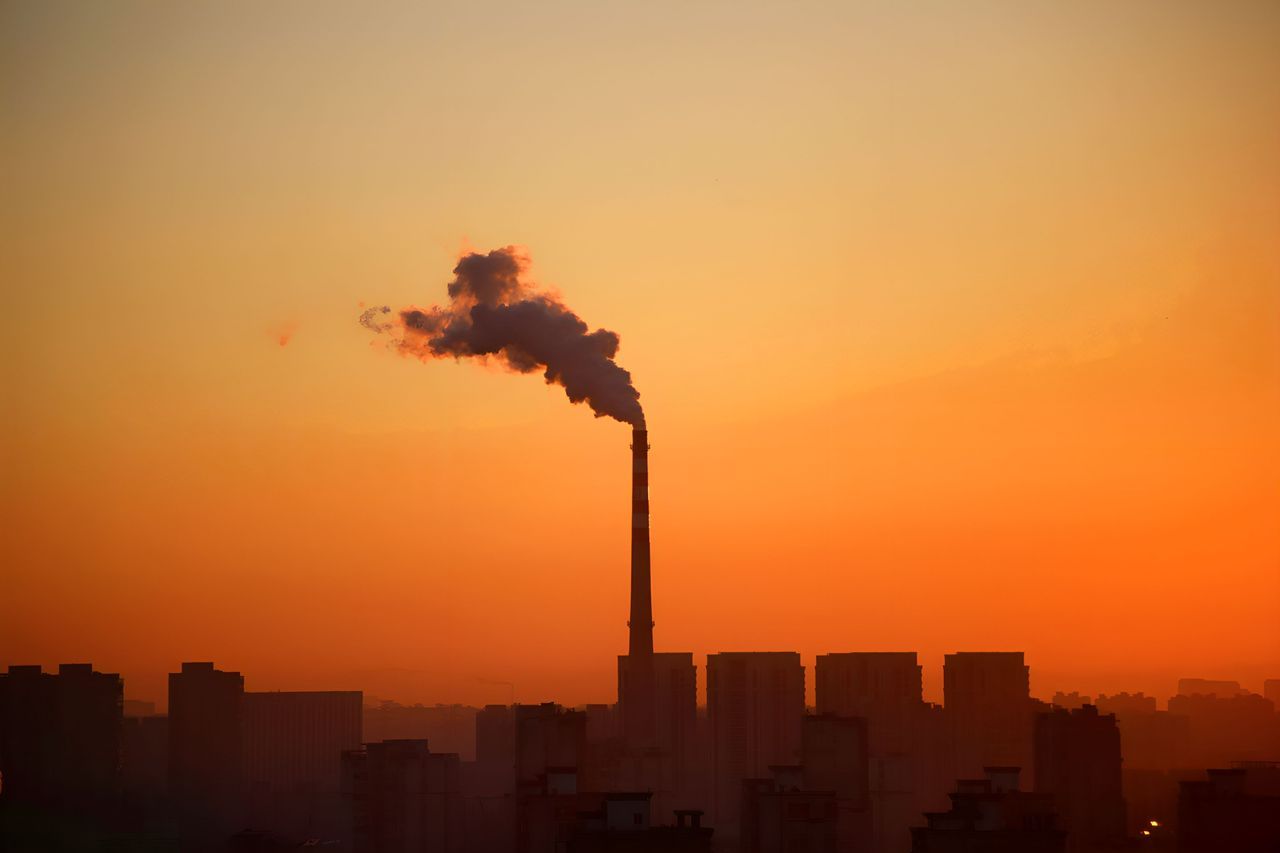
Outside cities, or in their immediate periphery, heavy industry constitutes another primary source of NOx. In any high-temperature combustion process, the nitrogen in the air inevitably oxidises. Process furnaces, industrial boilers, gas turbines and flares from oil and gas facilities all emit NO as a direct byproduct of their operation. Refineries and petrochemical plants are particularly relevant because they combine multiple simultaneous emission points and operate continuously, 24 hours a day.
Thermal generation plants (coal-fired stations, combined cycle gas and cogeneration) have historically been one of the largest sources of NOx emissions across Europe. Regulation has driven significant reductions through technologies such as selective catalytic reduction (SCR), but they remain a relevant source of emissions where the energy mix still depends on fossil fuels.
Agricultural sector
Agriculture is the major global emitter of N2O, and its environmental contribution is difficult to ignore. Agricultural emissions of this gas reached 8 million metric tonnes in 2020, 67% more than in 1980, driven primarily by the expansion of synthetic nitrogen fertiliser use and manure management in intensive livestock operations.
74% of anthropogenic N2O emissions from the last decade come from agricultural production. Global Nitrous Oxide Budget 2024.
The mechanism of N2O emission in agriculture is microbiological. Soil bacteria decompose nitrates and ammonium present in fertilisers and animal residues through nitrification and denitrification processes, releasing N2O as a byproduct. The amount of N2O emitted depends on fertiliser type, soil temperature and moisture, pH and application practices, which makes emissions diffuse, variable and notoriously difficult to quantify without a dedicated monitoring network.
N2O, with a global warming potential 273-300 times higher than CO2 over a 100-year horizon, means that every tonne of unmeasured and uncontrolled agricultural N2O is equivalent to hundreds of tonnes of CO2 that the climate system absorbs without record.

Nitrogen oxides (NOx) and nitrous oxide (N2O) constitute the greatest active threat to the stratospheric ozone layer, and ambitious reductions could prevent up to 20 million premature deaths before 2050.
Impact of NOx and N2O on health and the environment
Measuring NOx and N2O is more than a regulatory obligation. It is a direct response to the documented consequences they have on the human body and ecosystems. Their effects operate on very different timescales (from an asthma attack in minutes to forest degradation over decades) but both share in common that they can be prevented if detected in time.
Respiratory and cardiovascular effects
NO2 acts primarily as an irritant to mucous membranes in the eyes, nose, throat and respiratory tract; it does so from relatively low concentrations, and in acute exposures to very high levels can cause pulmonary oedema. In the long term, sustained exposure to NO2 is associated with slower lung development in children, higher incidence of chronic bronchitis, exacerbations of asthma and COPD, and increased risk of lower respiratory tract infections. Particularly concerning is the evidence linking chronic NO2 exposure to damage to the immune system.
The cardiovascular impact of air pollutants derived from NOx (particularly tropospheric ozone and secondary nitrate particles they form) is equally scientifically notable. They increase (1–3%) the risk of acute myocardial infarction with increased exposure. Inhalation of tropospheric ozone has been shown to be linked to a higher incidence of stroke and cerebrovascular accidents.
The WHO estimates that outdoor air pollution causes 4.2 million premature deaths per year worldwide, with cardiovascular and respiratory diseases as the main causes.
Environmental effects
In ecosystems, NOx exert their damage through two main mechanisms: acidification and eutrophication. By reacting with atmospheric moisture they form nitric acid, a precursor to acid rain that acidifies soils and water bodies, damages biodiversity in rivers and lakes and corrodes buildings and monuments. Excess nitrogen deposited in aquatic ecosystems triggers eutrophication, causing uncontrolled algae growth and depletes dissolved oxygen, suffocates aquatic fauna and ultimately destroys the local food chain.
For vegetation, tropospheric ozone formed from NOx is a potent oxidant that blocks plants’ photosynthetic capacity, reduces agricultural yields and weakens forests against pest and disease attack. This damage has a dual climate consequence since vegetation in degraded ecosystems, by capturing less CO2, amplifies the greenhouse effect that the pollutants themselves help generate.
Exposure peaks and cumulative risks
One of the most relevant epidemiological findings is that NO2 effects on health occur even within current legal limits.
Short-interval exposure to NO2 is associated with an increase in paediatric emergency visits for acute respiratory diseases, even when levels are within allowable air quality range. Fonderson M.S. et al. 2025.
Whilst in adults, increases in environmental NO2 concentration are associated with a statistically significant increase in emergency visits for asthma exacerbation, even in urban areas with relatively low pollution.
This scientific evidence introduces the concept of cumulative risk. It is when prolonged exposure to low or moderate concentrations generates progressive damage to respiratory, cardiovascular and immune systems, but manifests clinically much later after exposure has occurred. For public health management, this means that monitoring only pollution peaks is insufficient. What is needed is continuous, real-time monitoring with high temporal resolution that allows assessment of both acute exposure and the accumulated pollutant burden over time.
The effects of NO2 exposure do not depend only on peaks, but also on cumulative exposure over time, which reinforces the need for continuous monitoring.
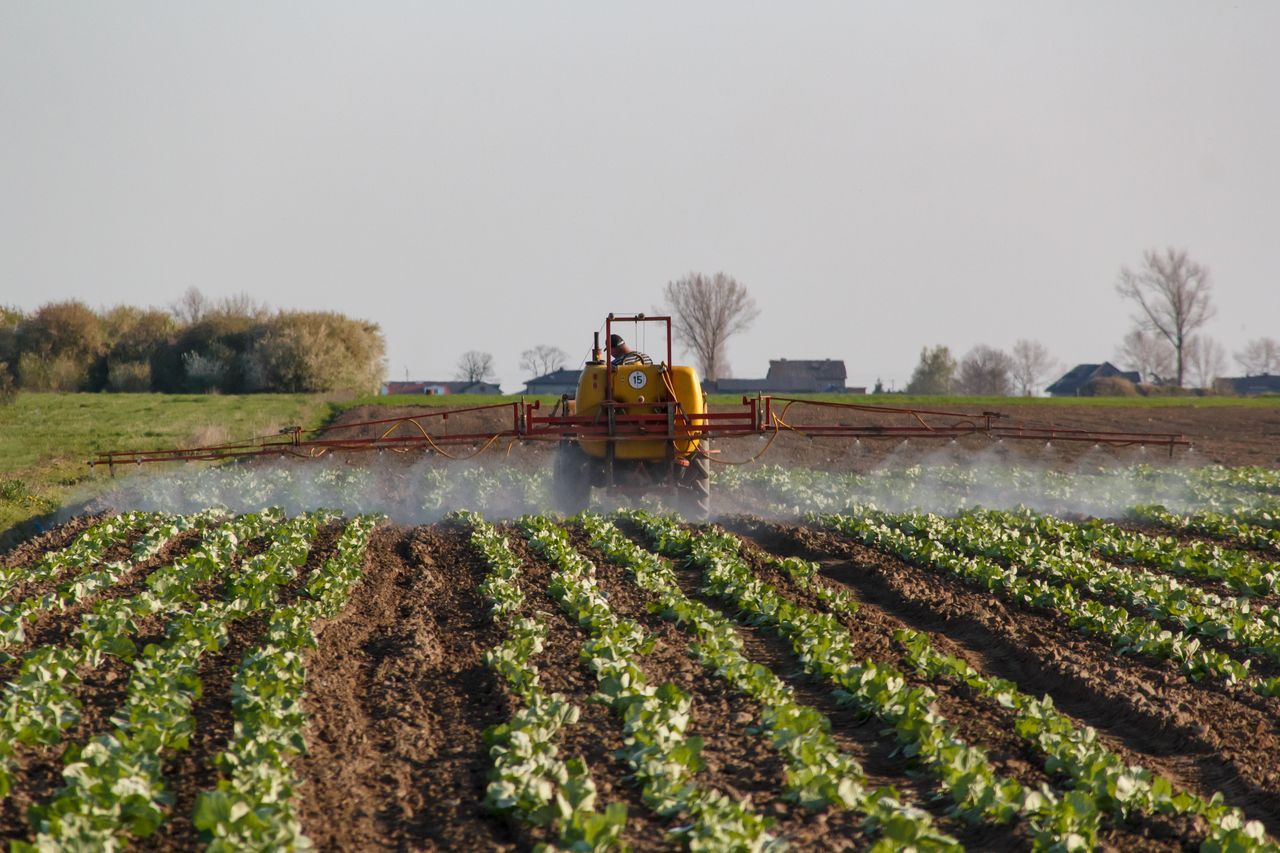
Agriculture is the major global emitter of N2O, and its environmental contribution is difficult to ignore.
Applicable regulations and standards
The regulatory framework on NOx and N2O is not based on a single document but a layered architecture. Through supranational directives and regulations that set the objectives, national regulations that transpose them into each country’s law and sectoral regulations that apply them to industries, agricultural activities and specific urban environments.
A tiered regulatory structure that is common to the main regulatory blocs in the world (European Union, United Kingdom, United States or frameworks derived from UN agreements on transboundary pollution); although limit values, timescales and compliance mechanisms vary significantly between jurisdictions. Understanding each level is essential to grasp what is measured, why it is measured and what legal, economic and reputational consequences there are for non-compliance.
The UNECE, or United Nations Economic Commission for Europe, one of five regional UN bodies, established the Convention on Long-range Transboundary Air Pollution (CLRTAP), signed in 1979 and in force since 1983. It is the first binding international treaty on air pollution and the framework under which the Gothenburg Protocols were negotiated, which set national emission ceilings for NOx, SO2, NH3 and VOCs for the 50 signatory countries (European, Canadian, US and other northern hemisphere countries).
European framework: from Directive 2008/50/EC to the new 2024/2881
The Directive 2008/50/EC of the European Parliament and of the Council, of 21 May 2008, on ambient air quality and cleaner air for Europe, is the reference standard that unified the scattered legislation in previous directives and established the mandatory limit values for NO2 in ambient air that remain in force today.
| Parameter | Limit value | Averaging period |
|---|---|---|
| NO2, health protection | 40 µg/m³ | Annual mean |
| NO2, health protection | 200 µg/m³ | Hourly mean (max 18 exceedances/year) |
| NOx, vegetation protection | 30 µg/m³ | Annual mean (critical level) |
However, this directive was born with its own limitations. In November 2024, Directive (EU) 2024/2881 came into force, which revises it in depth and significantly tightens limits. Thus the annual NO2 limit value is reduced to 20 µg/m³ by 2030, aligning with WHO guidelines. Member States have until 11 December 2026 to transpose this directive into their national legislation; the final horizon of the standard is ambitious to achieve zero air pollution by 2050.
Spanish transposition: RD 102/2011 and RD 1052/2022
In Spain, Directive 2008/50/EC was incorporated into the legal system through Royal Decree 102/2011, of 28 January, on the improvement of air quality, developed under the Law 34/2007 on air quality and atmospheric protection. This decree reproduces the European limit values for NO2 and NOx, establishes the requirements for assessment and management of air quality by zones and agglomerations, and requires autonomous communities to draw up action plans when there is risk of exceeding alert thresholds.
Royal Decree 34/2023, of 24 January updated RD 102/2011 adapting it to the most recent scientific evidence and introduced new reporting obligations and improvements to assessment systems. In parallel, Royal Decree 1052/2022, of 27 December established the specific regulatory framework for Low Emission Zones (LEZ), developing the mandate of Article 14.3 of Law 7/2021 on climate change and energy transition.
Low Emission Zones (LEZ) are today the main practical implementation instrument of NOx limits in urban environments. They define which vehicles can circulate in the most polluted areas, when and under what conditions, converting normative thresholds into concrete territorial restrictions. Their effectiveness (and the ability to demonstrate they are actually reducing NO2 levels) depends directly on having reliable monitoring networks with high spatial resolution.
Spain now faces a new transposition of significance. The Ministry for Ecological Transition is working on a new draft Royal Decree that must incorporate the limits of Directive 2024/2881 (including the new annual value of 20 µg/m³ for NO2) before the December 2026 deadline.
Industrial and agricultural regulations
Beyond ambient air quality, industrial emission sources are regulated by the Industrial Emissions Directive (IED) 2010/75/EU, recently revised by the Directive 2024/1785/CE, more commonly known as IED 2.0, which broadens its scope to regulate large industrial installations with stricter limits under the Best Available Techniques (BAT) principle and creates a new transparency portal (E-PRTR) for public notification of pollutants, including NOx. This regulation affects refineries, combustion plants, petrochemical installations and other large industrial facilities, thus subjecting them to operating permits with legally binding emission limits.
For agricultural machinery and non-road engines, the Stage V standard came fully into force in 2025, establishing strict limits on NOx emissions from tractors, harvesters and all types of diesel-engined machinery.
Where regulation still has its greatest gaps is in diffuse N2O emissions from the agricultural sector. Nitrogen fertilisers and manure management are not subject to direct emission limits comparable to those in industry, but rather to national reduction plans framed within the NEC Directive (National Emission Ceilings) and the EU’s climate commitments of the Effort Sharing Regulation 2018/842, making monitoring the air in agricultural settings an indispensable tool for reliably quantifying and reporting these emissions.

Measuring NOx and N2O is more than a regulatory obligation. It is a direct response to the documented consequences they have on the human body and ecosystems.
Monitoring NOx and N2O
Understanding NOx and N2O concentrations in the air is the prerequisite for action. Without reliable, continuous and geographically relevant data, no emissions reduction policy can be evaluated, no low emission zone can be defended before authorities and no industry can demonstrate that it meets its emission limits. Monitoring is, in that sense, the central axis of air quality management.
Near-reference sensors and certifications: CEN/TS 17660, MCERTS and EPA
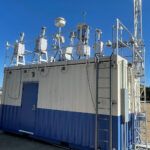
For decades, measurement of atmospheric pollutants was the exclusive territory of reference analysers. But these are expensive laboratory equipment, bulky, requiring specialised maintenance and therefore could only be deployed at a limited number of fixed points. Near-reference sensors have changed that equation. They are compact, autonomous, connected devices that offer performance levels close to reference standards, with a fraction of the cost and operational complexity.
The threshold separating a quality air sensor from a near-reference sensor is validation against recognised technical standards. Kunak AIR stations are calibrated and verified in-factory according to the European standard CEN/TS 17660, the EU reference technical standard for ambient air quality sensorMeasuring air quality is essential for improving human and environmental health. Changes in the natural composition of the air we breathe are common in ind...
Read mores, achieving Class 1 Data Quality Objectives (DQO) (the most demanding category in the standard). Their data is also traceable to US EPA protocols: EPA/600/R-23/14 for NO2, CO and SO2, and EPA/600/R-20/279 for ozone, thus meeting requirements of both European and North American regulatory frameworks.
MCERTS certification, the certification scheme of the UK environmental regulator (Environment Agency), adds an additional layer of independent validation. To this is added KOTITI certification, awarded by South Korea’s reference testing and certification institute, which accredits Kunak AIR Pro in the Asian market under independent verification standards equivalent to European ones.
The result is a Kunak AIR Pro sensor with quadruple international accreditation (CEN/TS 17660 Class 1, US EPA, MCERTS and KOTITI) positioning it among the near-reference devices with the greatest external validation backing currently available on the market.
The Kunak NO2 sensor incorporates electrochemical technology with an integrated ozone filter that eliminates interferences produced by O3 (one of the main accuracy problems in conventional electrochemical sensors), enabling measurement of reliable concentrations in both high-pollution urban environments and rural areas with very low levels of this pollutant.
Distributed monitoring networks: from fixed point to territorial coverage
The true power of near-reference sensors does not lie in an isolated device but in their ability to form distributed networks that transform air quality into a variable with high spatial and temporal resolution. A single traditional reference station offers a point datum; a Kunak sensor network deployed over territory offers a dynamic map of pollution that enables identification of hotspots, comparison of zones, detection of episodes and correlation of concentrations with specific sources.
Networks can be structured at different levels depending on the operational environment and objectives pursued. Hybrid networks (combining reference stations with near-reference sensor networks) are particularly effective because they allow reference stations to serve as calibration anchors whilst sensors provide the spatial density that reference equipment cannot offer. This model is what Kunak is deploying in both urban and industrial environments. In the Pure Cities project in Belgium, networks of Kunak AIR Lite stations measure pollutants and meteorological variables across multiple cities in real time, providing territorial coverage impossible to achieve with reference stations alone.
The same principle operates at industrial scale in a chemical plant in Germany, where consolidated reference methods already existed. Progressive deployment of Kunak sensors is enabling complementation of those point measurements with a distributed network providing a more representative and continuous image of the facility’s actual activity and its impacts on the surrounding environment.
In both cases, the logic is the same. Whilst reference equipment guarantees traceability, near-reference sensors provide the density and resolution that convert data into actionable knowledge.
Distributed monitoring converts air quality into a living map, capable of revealing hotspots, episodes and patterns that isolated measurement would never show.
Applications by environment: urban, industrial and agricultural
In urban environments, NOx monitoring focuses on NO2 as an indirect indicator pollutant for traffic as it best represents and summarises the total polluting footprint of traffic. Sensor networks allow assessment of the real impact of measures such as LEZ, identification of streets or intersections with chronic pollution peaks, correlation of episodes with meteorological conditions and provision of real-time information to citizens. The spatial resolution they offer is impossible to achieve with conventional fixed stations. For example, where a city may have 10–15 reference stations, a Kunak network can deploy 50, 100 or more measurement stations.
In industrial environments, monitoring covers two differentiated types of applications. The first is measurement at emission sources (chimneys, flares, furnaces) where sensors directly measure gases at the exit point to verify compliance with limits set in environmental permits. The second is perimetral monitoring (atmospheric immissionsAn atmospheric immission is the concentration of a pollutant detected in the atmosphere whose presence modifies the natural composition of the air. Its ori...
Read more) through a distributed sensor network around the facility that detects fugitive emissions, quantifies impact on the surrounding environment and identifies intermittent leaks that periodic inspection methods cannot capture. Kunak AIR stations can be configured to simultaneously measure NO, NO2, NOx, SO2, H2S, VOCs, CH4 and suspended particles, among many others, adapting to the specific needs of each type of industrial installation and activity.
In the agricultural sector, the challenge is radically different. N2O emissions are diffuse, variable and occur over large surfaces. Field monitoring with rapid-deployment wireless sensors enables real-time quantification of emissions as a function of fertilisation practices, soil conditions and meteorology, generating the data necessary for national emissions inventories and for demonstrating the effectiveness of more sustainable agricultural practices. In a field where diffuse N2O emissions still lack direct limits comparable to those in industry, the ability to measure them rigorously is the first step towards their effective regulation.

NOx are the invisible architects of photochemical smog and N2O is the third most potent greenhouse gas after CO2 and methane (CH4).
Best practices for control and reduction
Measuring is essential, but the ultimate goal is to reduce. Strategies for controlling NOx and N2O are today articulated across three complementary fronts (urban, industrial and agricultural) that require different approaches but share a common premise: without reliable monitoring data, there is no way of knowing whether adopted measures are actually working.
Low emission zones, electric mobility and sustainable transport
Low Emission Zones (LEZ) are currently the most widespread urban policy instrument in Europe for reducing population exposure to NOx from traffic. In 2025 there were already 507 LEZ operating in Europe, a 58% increase from 2022, driven by new national laws mandating their implementation. For example, in Spain, the Climate Change Law 7/2021 required all municipalities of more than 50,000 inhabitants to establish their LEZ before 2023, under the framework of RD 1052/2022.
Nevertheless, their effectiveness depends largely on the rigour with which restrictions are applied and the ambition of the excluded vehicle categories. Europe’s most effective LEZ (London, Paris, Amsterdam and Brussels) combine access restrictions on the most polluting vehicles with active incentives for electric mobility, low-emission public transport and active mobility (cycling, walking).
Monitoring with sensor networks is the tool that converts LEZ from administrative measure into evidence-based policy. It allows assessment of whether NO2 levels actually decline within the restricted perimeter, identification of whether vehicles are respecting restrictions and demonstration to citizens and institutions that investment in sustainable mobility produces measurable results.
Urban, industrial and agricultural policies can only improve air quality if their effects are measured continuously and defensibly.
Reducing emissions in industrial processes and energy generation
In the industrial sector, NOx reduction is articulated primarily through the concept of Best Available Techniques (BAT), the technical-legal framework that IED 2.0 mandates for application in all large installations. BAT for industrial NOx reduction includes both primary prevention technologies (combustion optimisation, low-NOx burners, combustion gas recirculation) and exhaust gas treatment. Selective Catalytic Reduction (SCR) and Non-Catalytic Selective Reduction (SNCR) are the most effective methods for removing NOx from stack gases before atmospheric emission, with efficiencies that can exceed 90% in well-designed facilities.
In energy generation, decarbonising the electricity mix is the most effective emissions reduction strategy. Each gigawatt-hour generated from renewables (solar, wind, hydro) is a gigawatt-hour that requires no combustion and therefore generates no NOx. Energy transition is not only climate policy: it is simultaneously the most effective air quality policy available in the long term. In the short term, progressive substitution of coal with natural gas in thermal generation plants has already produced significant NOx reductions across Europe. Although natural gas does not eliminate the problem and may even, in some scenarios, generate greater impacts than NOx; the most critical impact being methane that escapes during natural gas extraction, transport and distribution, generating fugitive emissions.
Similarly, continuous perimetral monitoring with multigas sensors in industrial facilities is increasingly an implicit requirement of the BAT framework. Without objective data on actual emissions (not only from declared sources, but fugitive emissions) it is impossible to demonstrate effective compliance or detect operational deviations before they become regulatory incidents.
Agricultural strategies: optimising fertilisation and N2O mitigation
The agricultural sector faces a singular challenge in needing nitrogen to produce food, yet its excess becomes N2O. Mitigation cannot consist simply of eliminating fertilisers, but in maximising nitrogen use efficiency, meaning the crop absorbs the greatest possible proportion of what is applied, minimising losses to soil and emissions to the atmosphere.
The most effective strategies are articulated around the principle of the 4R of fertilisation: applying the correct fertiliser (Right source), in the correct dose (Right rate), at the correct time (Right time) and in the correct place (Right place). In practice, this translates to:
- Precision agriculture: soil sensor technologies, satellite imagery and data analysis that allow fertiliser dose adjustment to the field’s actual variability, avoiding over-fertilisation in certain zones.
- Nitrification inhibitors: compounds that delay bacterial conversion of ammonium to nitrate, directly reducing microbial N2O production in soil.
- Controlled-release fertilisers: formulations that release nitrogen progressively and synchronised with crop demand, reducing excess available for nitrification processes.
- Manure management: covered storage techniques, anaerobic digestion and injection application that reduce N2O and NH3 emissions compared to conventional surface application.
- Integration of legumes: biological nitrogen fixation by legume plants reduces dependence on synthetic fertilisers, though it also produces N2O, making optimisation of their management necessary.
Quantifying the impact of these measures is, paradoxically, one of the sector’s greatest challenges. Diffuse N2O emissions are extremely variable in space and time, and default emission factors used in national inventories have large uncertainties. Deploying field sensor networks measuring actual N2O concentrations under different agronomic and climatic conditions is the step that will allow moving from statistical estimates to verified data, a condition essential for agricultural mitigation strategies to be recognised and accounted for in international climate reporting mechanisms.
Reducing agricultural N2O does not consist of fertilising less, but of measuring better to apply nitrogen where the crop needs it and demonstrate its real impact.

The real scope of the environmental impact of nitrogen oxides (NOx) and nitrous oxide (N2O) elevates them to urgency when they exceed established limits.
FAQs on NOx and N2O
What pollutants make up NOx and N2O?
NOx primarily groups nitric oxide (NO) and nitrogen dioxide (NO2), both generated in high-temperature combustion processes. Nitrous oxide (N2O) is a different compound, primarily of agricultural origin, with a more stable molecular structure and far-reaching climate effects.
What are the main urban, industrial and agricultural sources?
NOx come from road traffic, heating, refineries, industrial plants and thermal energy generation. N2O originates mainly in the bacterial decomposition of nitrogen fertilisers and manure in agricultural soils and livestock facilities.
How do they affect health and climate?
NOx cause respiratory and cardiovascular diseases and are precursors to smog and tropospheric ozone. N2O is the third most potent greenhouse gas and the main current destroyer of the stratospheric ozone layer.
What regulations govern their emissions?
The regulatory framework for NOx varies by jurisdiction, but shares common objectives. In the European Union, Directive 2024/2881 sets a limit of 20 µg/m³ of NO2 by 2030, whilst the NEC Directive (2016/2284) establishes national emission ceilings for NOx. In the United Kingdom, following Brexit, the MCERTS scheme and legislation derived from the Environment Act 2021 maintain standards equivalent to European ones. In the United States, the EPA regulates NO2 under the Clean Air Act with an annual limit of 53 ppb (~100 µg/m³) and an hourly standard of 100 ppb, periodically reviewed through the National Ambient Air Quality Standards (NAAQS). At global scale, the reference framework is the CLRTAP Convention of the UNECE and the Gothenburg Protocol, which bind over 50 northern hemisphere countries (including the US and Canada) in NOx, SO2, NH3 and VOC reduction commitments.
What technologies enable their precise monitoring?
Near-reference sensors such as those used in Kunak AIR Pro and Lite stations are calibrated and verified in-factory according to the European standard CEN/TS 17660, the EU reference technical standard for ambient air quality sensors. They also hold MCERTS certification, the certification scheme of the UK environmental regulator (Environment Agency), which adds an additional layer of independent validation. This certification allows measurement of NOx in real time with data traceable to European reference standards and the US EPA, in both complex urban environments and industrial settings as well as vast agricultural areas. Kunak AIR stations also hold KOTITI certification, awarded by South Korea’s reference testing and certification institute, accrediting them in the Asian market under independent verification standards equivalent to European ones.
Nitrogen oxides (NOx) and nitrous oxide (N2O) are among the most monitored pollutants.
Conclusion: NOx and N2O – what we know, what we measure, what we can change
NOx and N2O are not pollutants of an industrial past that clean technology will gradually eliminate of its own accord. They are gases produced today, at every red traffic light in a congested city, in every chimney of a plant operating within its legal limits and in every hectare of field fertilised with ammonium nitrate. Their presence is structural in modern economies and their impact (respiratory, cardiovascular, climatic, ecological) operates simultaneously and cumulatively on scales ranging from the neighbourhood to the planet.
What has changed profoundly in recent years is not the nature of the problem but the ability to measure it. The availability of near-reference sensors such as those from Kunak (calibrated under CEN/TS 17660 standard, MCERTS certified and validated by US EPA) has democratised access to high spatial and temporal resolution air quality data that previously was only available to large institutional reference networks. That democratisation has direct practical consequences such as a city can now deploy dozens of measurement stations for the same cost as a single reference station; an industry can monitor its complete perimeter continuously rather than relying only on periodic point inspections; an agricultural operator can quantify actual emissions from their fields instead of estimating them with default factors.
The benefits of that measurement capability materialise differently depending on the sector, but converge on a single objective. Advanced monitoring is not a technical accessory but the data infrastructure on which any serious air quality protection strategy is built and, ultimately, the protection of the planet.
 Near-reference monitoring: advanced accuracy in air quality measurement
 Data center air quality monitoring: applications, parameters and sensors
 Remediation air monitoring: real-time emissions control and compliance
 PM10 measurement in coarse particle environments: why sensor technology matters
 Urban traffic emissions monitoring: advanced air quality control for sustainable mobility