Stack emissions are gases and particles released into the atmosphere through chimneys, ducts or outlets of stationary industrial sources, such as power plants, refineries, cement works, chemical plants and incinerators. They are measured through periodic stack tests or continuous automatic monitoring systems to quantify pollutants such as NOx, SO2, CO, CO2, VOCs and particulate matter, check compliance with emission limits and assess their impact on air qualityAir quality refers to the state of the air we breathe and its composition in terms of pollutants present in the atmosphere. It is considered good when poll...
Read more.
This type of stack emissions monitoring is the basis of regulatory compliance for stationary sources, since it makes it possible to convert the concentration measured in the stack into a mass emission rate (the quantity of a pollutant leaving a stack or emission point per unit of time) and compare it against the limit values set by the applicable local regulation, whether through isokinetic reference sampling or through certified automatic monitoring systems that operate continuously.
Continuous stack emissions monitoring does not replace regulatory in-stack measurement; it provides the visibility needed to understand how those emissions translate into real air quality outside the discharge point.
Below we look at what stack emissions are, which industrial sources produce them and which pollutants they typically contain, from nitrogen and sulphur oxides to particulate matter and volatile organic compounds. We also distinguish channelled emissions from fugitive emissions, describe the main measurement methods and review the regulatory framework governing emission limits in the European Union and the United States. Finally, we look at the environmental impact of these emissions beyond the stack and the role played by ambient and fenceline monitoringFenceline monitoring is the continuous measurement of air quality along the boundary of an industrial facility using environmental monitoring technologies ...
Read more as a complementary layer to capture their real scope in terms of air quality around the emission point.

Continuous stack emissions monitoring does not replace regulatory in-stack measurement; it provides the visibility needed to understand how those emissions translate into real air quality outside the discharge point.
What are stack emissions
Stack emissions, or channelled emissions, are mixtures of gases and particles that are generated in an industrial process and released into the atmosphere through a defined duct or discharge point: the stack; the factor that sets them apart from other types of discharge. Because they come from a point source or stationary source, the flue gas travels through an identifiable duct before reaching the outside air, rather than escaping in a dispersed way from multiple points across the facility.
Air Quality Innovation in Just 1 Click
Stay informed about the air you breathe!
Subscribe to our newsletter to receive the latest updates on environmental monitoring technology, air quality studies, and more.
Channelling waste gases into a single outlet duct makes it possible to set a specific emission limit value (ELV) for that source, fixed in the facility’s environmental permit according to the activity and the surrounding area’s capacity to absorb pollution. This channelling also makes it easier to apply abatement systems (filters, gas scrubbers, catalytic converters) right before the outlet point. It also allows measurement equipment to be installed directly on the duct, either manually, capturing the pollutant for laboratory analysis, or through automatic systems that read the concentration continuously.
Stacks, ducts and stationary sources
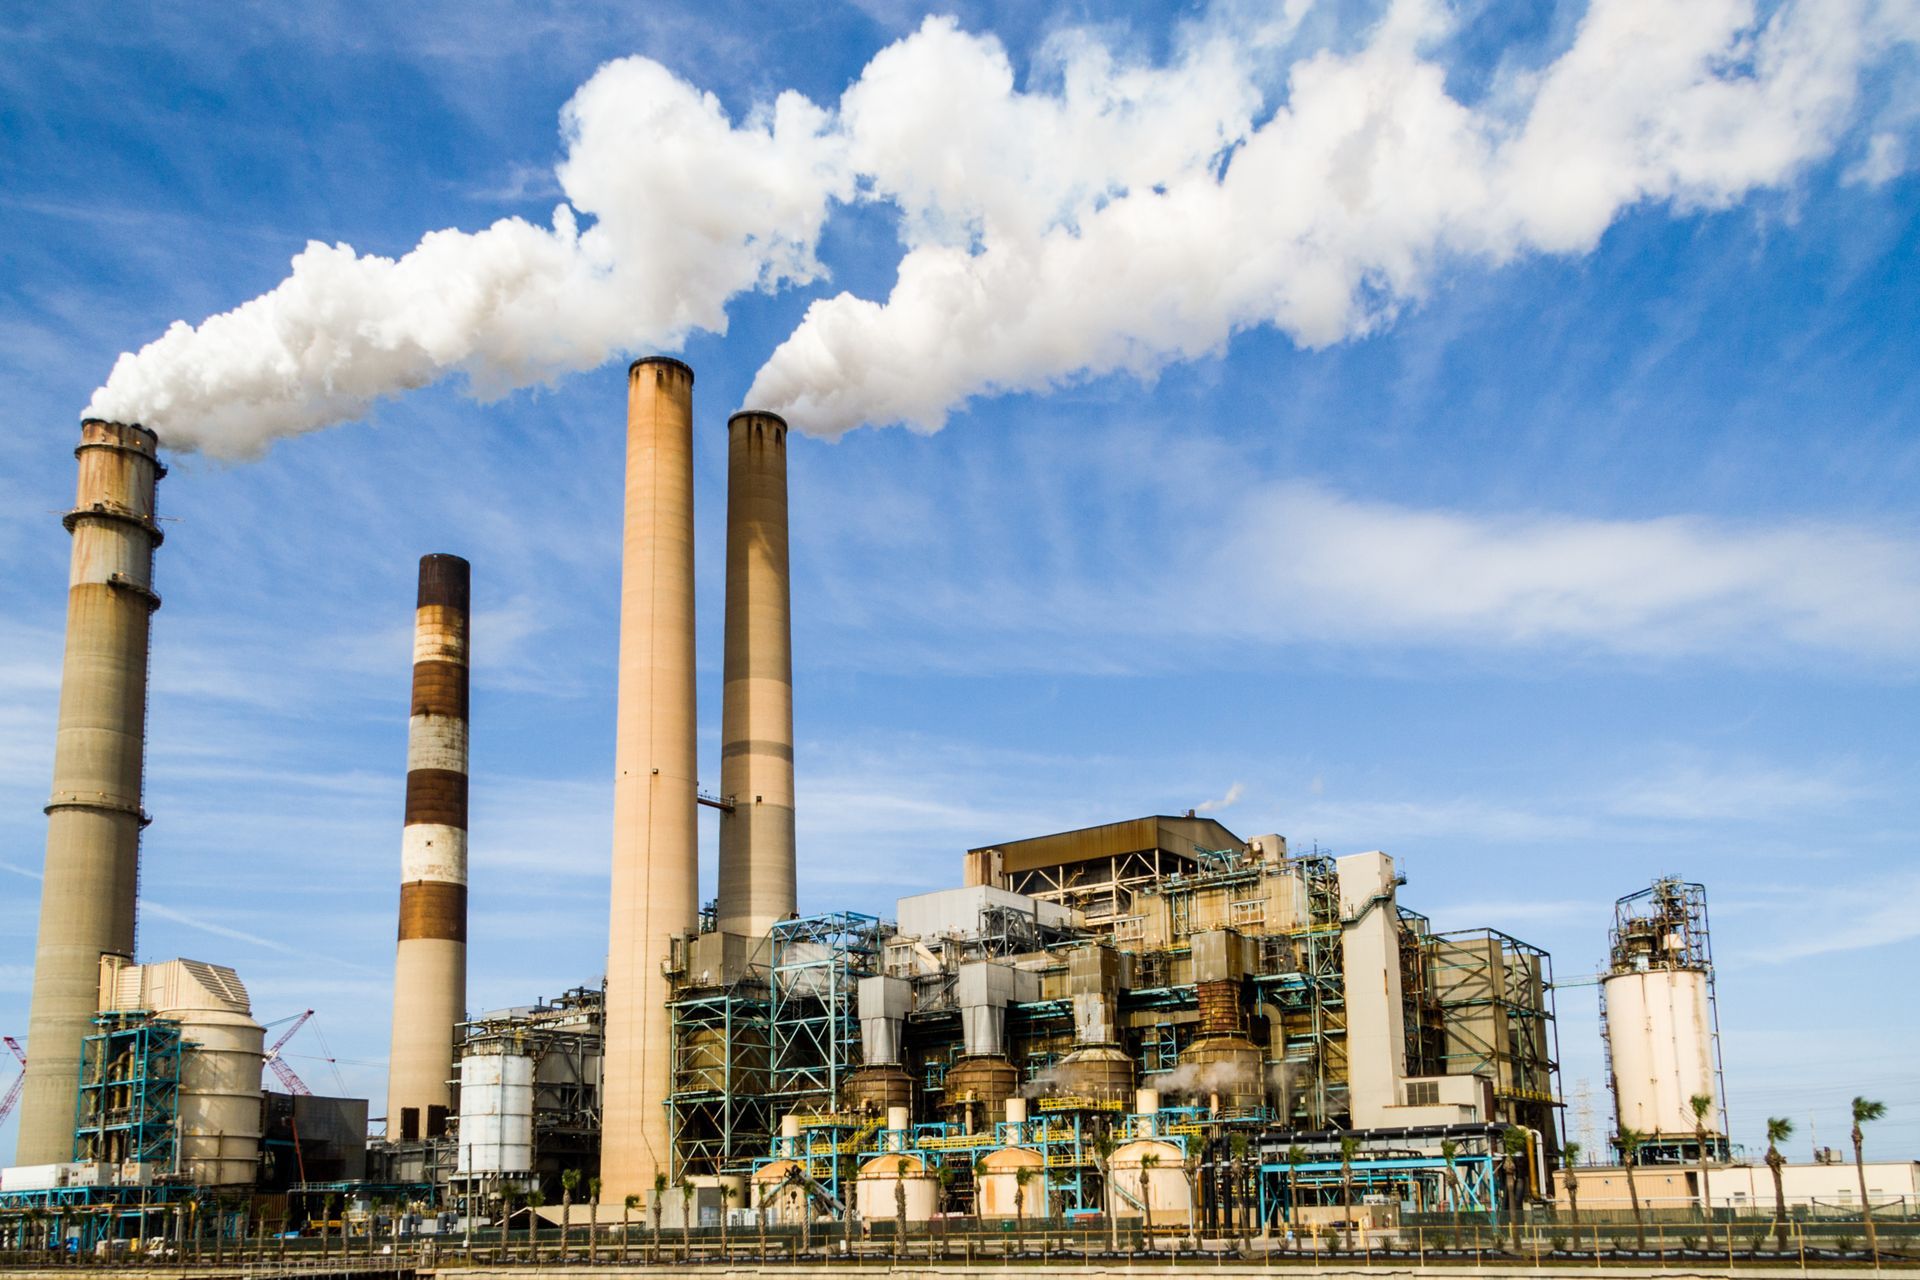
A stack emission always comes from a stationary source, that is, a fixed installation such as a power plant, a cement works or an incinerator, whose flue gas travels through a duct before reaching the outside air. This channelling is the key point from a regulatory standpoint, since the rules require emissions to be conducted through a stack whenever technically possible, precisely because a channelled source can be measured, quantified and controlled with precision, whereas emissions that escape without passing through a duct, such as leaks from valves, flanges or storage areas, are considered diffuse or fugitive emissions and therefore require different monitoring methods.
The key points that define a stack emission are:
- Origin in an identifiable industrial process (combustion, calcination, incineration, chemical synthesis, among others).
- Release through a fixed and locatable duct or discharge point.
- A variable composition of gases (NOx, SO2, CO, CO2, VOCs) and particulate matter, depending on the activity and fuel used.
- The possibility of direct measurement through manual sampling or continuous automatic systems.
- Subjection to an emission limit value set in the corresponding environmental permit.
There is not always a direct correlation between the emitting stack and the activity that generates the emissions, since a single stack can collect gases from several different processes within the same facility.
Differences between channelled, fugitive and diffuse emissions
Not every industrial emission reaches the outside air through a duct. Three categories should be distinguished:
| Type of emission | Description | Example | How it is monitored |
|---|---|---|---|
| Channelled emissions | Released outside through a stack or a fixed duct, which allows them to be measured directly at the outlet point. | Stacks of boilers, furnaces or industrial processes. | In-stack measurement through continuous emission monitoring systems (CEMS) or periodic campaigns. |
| Fugitive emissions | Escape unintentionally through elements such as valves, flanges, pumps, seals or storage tanks, without passing through a duct. | VOC, methane or H2S leaks from process equipment. | LDAR programmes (Leak Detection and Repair), portable sensors or fenceline monitoring networks. |
| Diffuse emissions | Come from open surfaces or activities with no defined emission point, so they cannot be captured through a stack. | Material stockpiles, loading and unloading operations, landfills or earthworks. | Ambient monitoring networks, fenceline sensors and pollutant dispersion modelling. |
Emission concentration versus ambient air concentration
An aspect that often causes confusion with this type of emission is that the concentration measured in the stack is not the same as the concentration people breathe outside the facility, known as ambient concentration. The emission concentration is measured right at the discharge point and serves to check compliance with the emission limit value set in the environmental permit. The ambient concentration is the result of that pollutant dispersing, diluting and transforming in the atmosphere according to weather conditions, topography and distance from the source, so it can be considerably lower (or, during specific episodes, behave differently) than the original concentration in the stack.
The difference between emission concentration and ambient concentration is the reason why many facilities complement in-stack measurement with ambient and fenceline monitoring networks, which are what actually report on the air quality breathed outside the emission point.
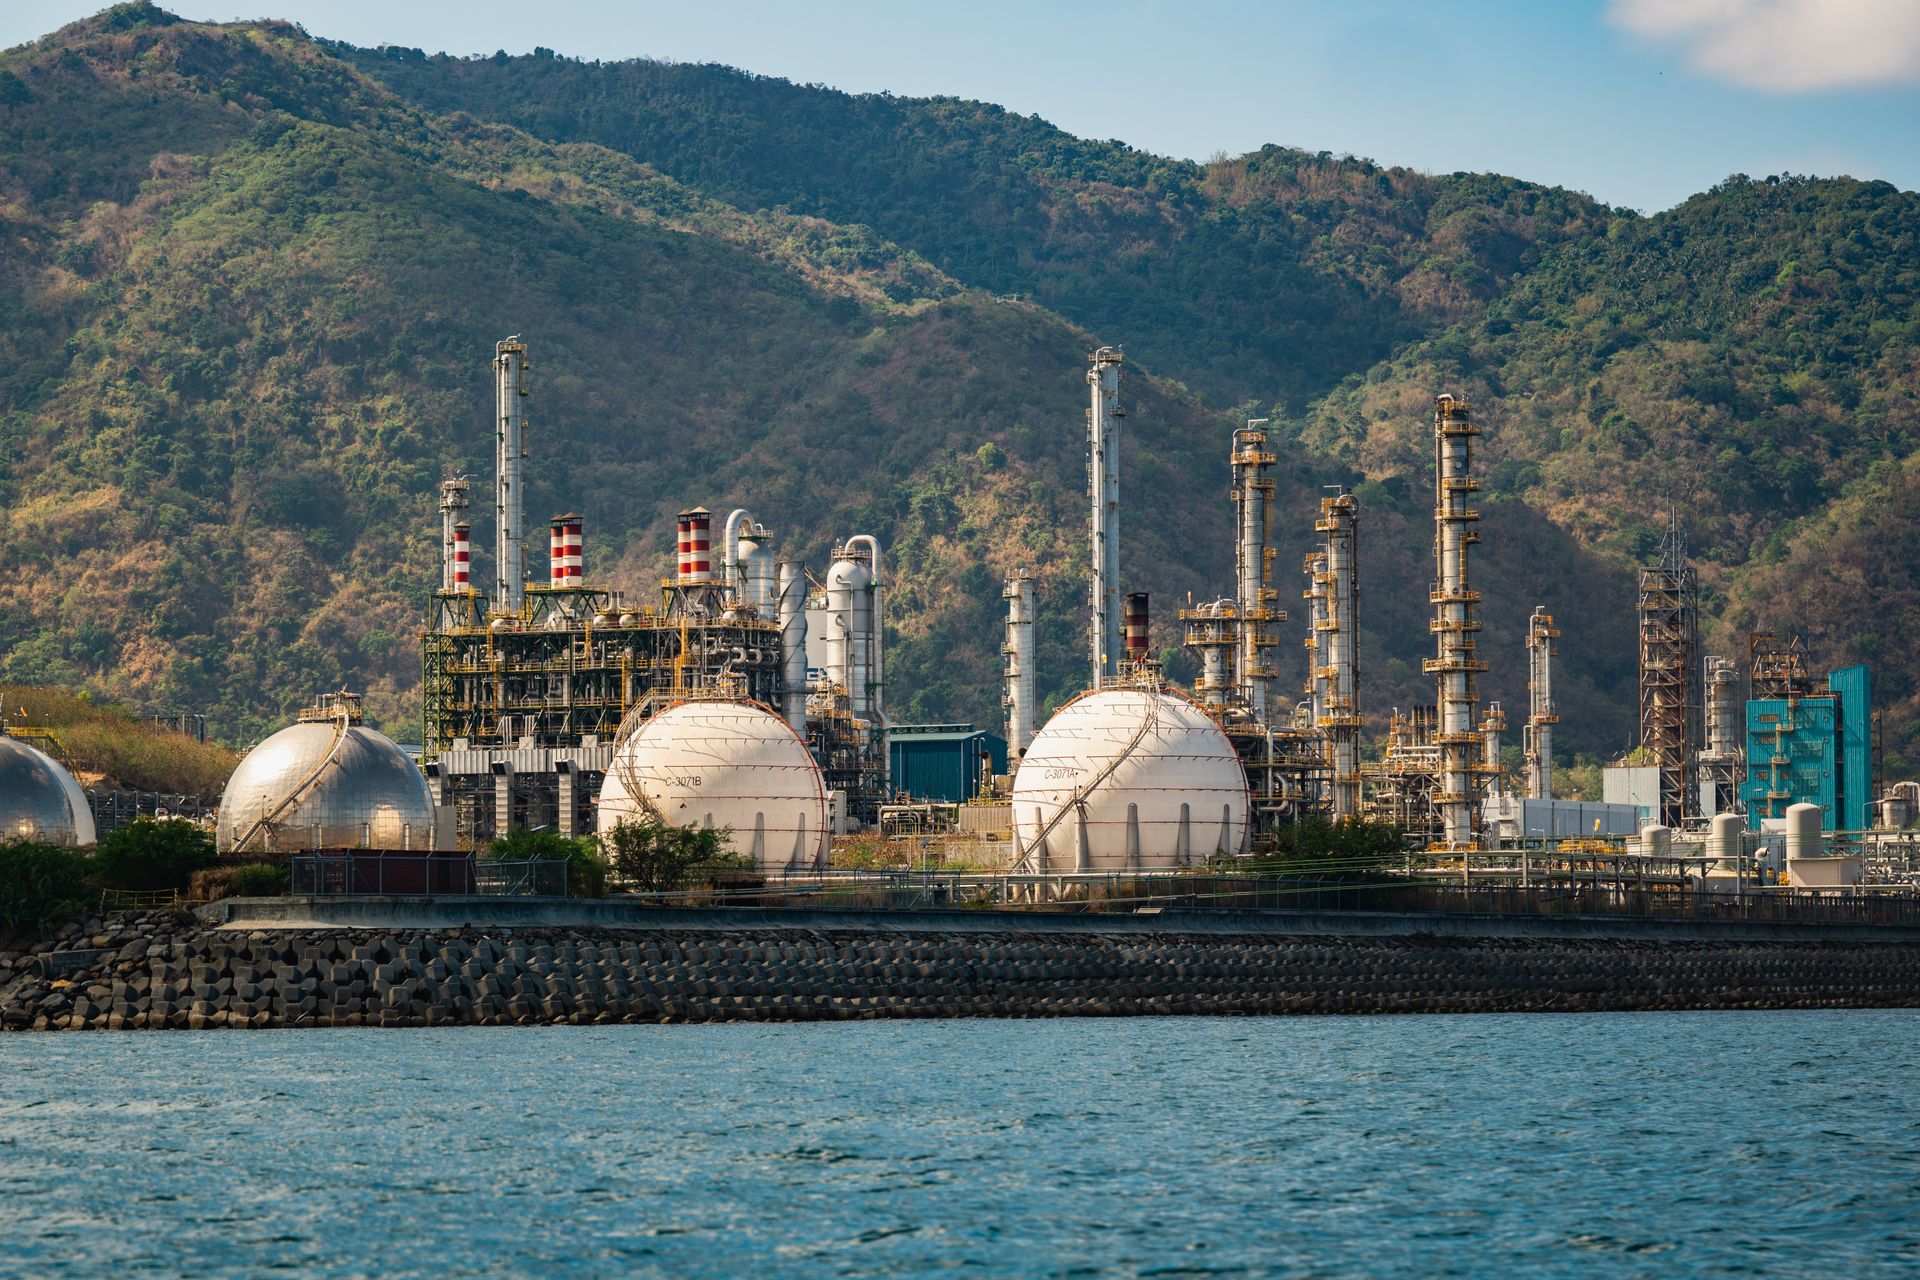
The most relevant emissions from refineries occur in process furnaces, which supply the thermal energy needed for reactions such as distillation, catalytic reforming, hydrotreating or alkylation.
Main industrial sources of stack emissions
Stack emissions come from a relatively small group of industrial sectors, each with combustion or chemical transformation processes that determine which pollutants they emit and in what proportion.
Power plants and combustion facilities
Power plants and other combustion facilities generate their main emissions, such as SO2, NOx, particulate matter, CO2 and heavy metals (As, Cd, Cr, Cu, Hg, Pb, Ni, Zn), from boilers and furnaces where fossil fuels are burned to produce electricity, steam or heat. The composition of these emissions varies according to the fuel used: fuel oil with a higher sulphur content raises SO2 emissions, while higher combustion temperatures favour the formation of NOx.
Refineries and petrochemical plants
The most relevant emissions produced by refineries occur in process furnaces, which supply the thermal energy needed for reactions such as distillation, catalytic reforming, hydrotreating or alkylation. These are joined by emissions from catalytic cracking units, flares and, more diffusely, VOCs released across different process units and during tank storage. The most characteristic pollutants in this sector are sulphur dioxide and nitrogen oxides, derived mainly from the fuel oils and refinery gas used as fuel.
Cement, boilers and mineral industries
Cement manufacturing generates quantitatively significant emissions of particulate matter, NOx, SO2, CO and CO2, together with smaller amounts of non-methane volatile organic compounds (NMVOCs), NH3 and chlorine. The most important point sources are the kiln and the clinker coolers, along with the precalciners and the raw material and cement mills, while the raw material and fuels used in clinkerisation can contribute trace amounts of heavy metals emitted as particulate matter or vapour. NOx emissions are produced mainly in the clinker kiln because of the high calcination temperatures, while SO2 emissions depend on the sulphur content of both the fuel and the raw materials.
Incinerators and waste thermal treatment plants
Incineration plants treat waste through controlled combustion, a process that generates flue gas with a particularly complex pollutant load, since the heterogeneous composition of the waste can give rise to toxic compounds that require specific abatement systems before release into the atmosphere. This sector tends to be subject to particularly strict emission limits, precisely because of the variability of the materials incinerated and the risk of generating persistent pollutants.
Chemical, metallurgical and manufacturing industries
The chemical industry shows a wide diversity of stack emissions depending on the product manufactured. Sulphuric acid production releases SO2 and sulphuric acid mist, hydrochloric acid production releases Cl2 and HCl, ammonia production emits mainly CO2 from the steam methane reforming used to obtain synthesis hydrogen (together with traces of unconverted NH3), and urea production emits NH3 and particulate matter, among other processes with their own emission profiles. In the metallurgical and manufacturing sector in general, emissions combine compounds derived both from the raw materials used (for example, alkaline compounds) and from the fuel used in drying and firing processes, mainly SO2, NOx, CO, particulate matter and NMVOCs.
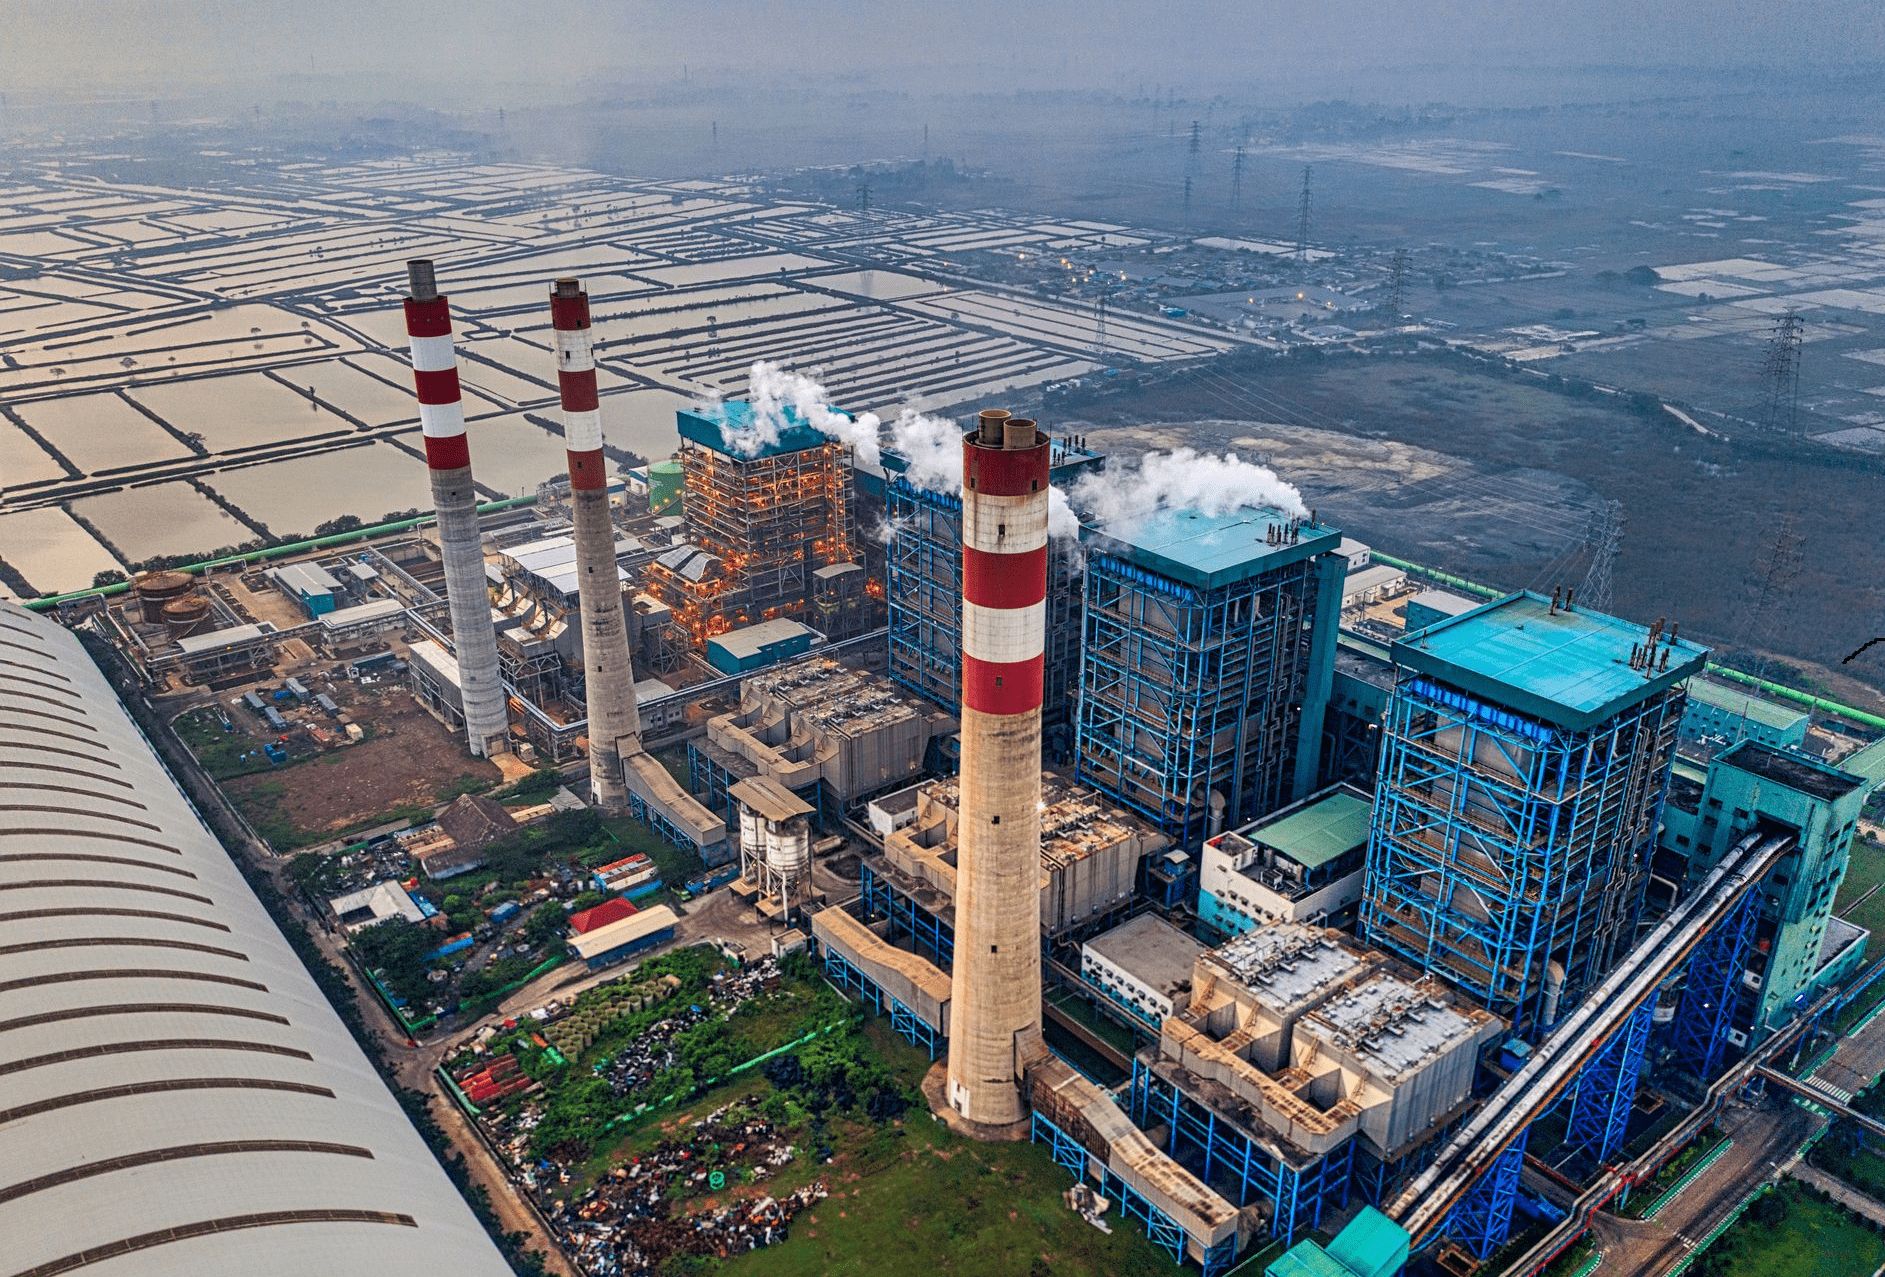
The composition of stack emissions depends on the fuel and the industrial process, which determines which pollutants must be monitored and how.
Main pollutants present in stack emissions
Since stack emissions contain a combination of gases and particles whose composition depends directly on the industrial process and on the fuel used, with the power sector responsible for most of the global volume emitted, it is worth looking at how the main gases are generated and their effects.
The composition of stack emissions depends on the fuel and the industrial process, which determines which pollutants must be monitored and how.
Nitrogen oxides, sulphur dioxide and carbon monoxide
Nitrogen oxides (NOx)Nitrogen oxides (NOx) and nitrous oxide (N2O) are key air pollutantsAir pollution caused by atmospheric contaminants is one of the most critical and complex environmental problems we face today, both because of its global r...
Read more affecting air quality and climate across multiple sectors: urban, industrial and agric...
Read more form mainly during combustion, either from the nitrogen contained in the fuel itself or from the nitrogen present in the air used to burn it, which is why they are directly linked to the temperature and design of the combustion process. Sulphur dioxide (SO2), by contrast, depends almost exclusively on the sulphur content of the fuel. In combustion systems, around 95% of the sulphur present converts to SO2, between 1% and 5% oxidises to sulphur trioxide (SO3), and between 1% and 3% is emitted as sulphate particulate matter. Carbon monoxide (CO)The carbon monoxide (CO) is an invisible gas (colorless and odorless) that, at the same time, is a silent killer because in just a few minutes it exhibits ...
Read more, for its part, is a toxic gas generated by incomplete combustion of fossil fuels, when there is not enough oxygen or temperature to complete the oxidation of carbon to CO2.
Carbon dioxide and greenhouse gases
Carbon dioxide (CO2) is the main greenhouse gas of industrial origin, and the power sector accounts for around 91.8% of its total emissions, compared with 6.4% from the cement industry and waste incineration, and 1.8% from the chemical and metallurgical industry. Alongside CO2, emissions inventories also consider methane (CH4) and nitrous oxide (N2O) as relevant greenhouse gasesGreenhouse gases (GHGs) are natural and anthropogenic gases that trap heat in the Earth's atmosphere, regulating the planet’s temperature. However, when th...
Read more, both with natural and anthropogenic sources, although human activity clearly dominates their emissions to the atmosphere. These are joined, in smaller volumes but with a much higher warming potential, by hydrofluorocarbons (HFCs), perfluorocarbons (PFCs) and sulphur hexafluoride (SF6).
Particulate matter, dust and particulates
Particles emitted during combustion processes usually have a diameter of less than 1 micrometre and cause environmental effects such as reduced visibility, acid rain and the deterioration of exposed materials. This particulate matter is usually classified by size (PM10, PM2.5) because that size fraction determines its capacity to penetrate the respiratory system and, therefore, its relevance to health. In sectors such as cement, dust comes both from the calcination process itself and from raw material handling and clinker cooling, which makes it one of the priority pollutants to control in the stack.
Volatile organic compounds and hazardous pollutants
Non-methane volatile organic compounds (NMVOCs) are organic compounds other than methane capable of generating photochemical oxidants when they react with nitrogen oxides in the presence of sunlight. This group is joined by persistent organic pollutants and toxic substances such as benzene, formaldehyde, acrolein and polycyclic aromatic hydrocarbons (PAHs), common in incomplete combustion processes.
Acid gases, metals and process-specific pollutants
Certain industrial processes generate highly specific pollutants. Sulphuric acid production releases unconverted SO2 and sulphuric acid mist or vapour; hydrochloric acid production releases unabsorbed gaseous HCl, chlorine and chlorinated organic compounds; and urea production emits ammonia and particulate matter, among other profiles specific to each chemical activity. As for metals, mercury stands out for its toxicity, persistence and capacity for bioaccumulation, with coal combustion as its main anthropogenic source, having contributed around 888 tonnes (46% of the world total) in 2005 according to UNEP data. Other trace metals such as arsenic, cadmium, chromium, copper, lead, nickel and zinc can also be emitted as particulate matter or vapour, from either the fuel or the raw materials used in the process.
Ambient and fenceline monitoring are the complementary layer needed to capture the real scope of industrial stack emissions on air quality around the emission point.
How stack emissions are measured
Stack emissions are quantified through two broad, complementary approaches. On one hand there are periodic tests, carried out at specific points in time by technical staff, while automatic monitoring systems allow continuous measurement because they are permanently integrated into the facility. Both share the same objective: determining the concentration of pollutants present in the flue gas to check compliance against the emission limit value set in the corresponding environmental permit. To determine that concentration, they rely on the following:
Periodic stack emissions testing
A periodic test consists of taking samples of the flue gas at specific points in time, usually at an annual or six-monthly frequency set by the applicable regulation, using standardised reference methods for each pollutant. This type of measurement is usually commissioned from accredited laboratories and offers a representative snapshot of emission conditions at the time of sampling, although it cannot detect variations occurring outside that time window.
Isokinetic particulate sampling
To measure particulate matter in a stack, isokinetic sampling is used, a technique in which the velocity at which gas enters the sampling probe is adjusted to match the velocity of the gas in the main duct. This adjustment is essential because, if the suction velocity differed from the actual flow velocity, it would result in a disproportionate capture of larger or smaller particles, distorting the outcome; that is why the sample flow rate is kept proportional to the flow rate of the gas emitted by the stack.
Continuous automatic emissions monitoring systems
Automatic monitoring systems, known internationally as CEMS (Continuous Emission Monitoring System), continuously monitor and record the emissions of stationary sources such as power plants, refineries, cement works and incinerators. A CEMS integrates gas analysers, particulate matter and opacity measurement systems, volumetric flow rate measurement and an emissions data management system (DAHS) that centralises the record and supports regulatory reporting. The pollutants most commonly monitored continuously are NOx, SO2, CO, CO2 and particulate matter, although HCl, HF, NH3, mercury or VOCs can also be included depending on the regulated activity.
Extractive systems and in-situ measurement systems
CEMS are divided into two main configurations depending on where the gas is analysed. Extractive systems capture a sample of the flue gas, transport it through a heated line to a conditioning unit (with pumps, coolers and converters) and analyse it outside the stack, in an analyser cabinet. In-situ systems, by contrast, carry out the measurement directly inside the duct, without extracting the sample, using technologies such as laser systems that pass through the gas flow itself. The choice between one or the other depends on factors such as the gas temperature, its moisture or particulate content, and the maintenance requirements of each industrial facility being analysed.
Concentration, flow rate and mass emission rate
None of these techniques is useful on its own without knowing the volumetric flow rate of the gas flowing through the stack, since the measured concentration (for example, in mg/m3) must be combined with that flow rate to obtain the mass emission rate in kg/h or g/s, the quantity that is actually compared against the regulatory emission limit. That is why both certified CEMS and periodic tests include volumetric flow measurement systems as an integral part of the installation, not just concentration analysers.
Without measuring the volumetric flow rate of the gas, it is not possible to convert concentration into a mass emission rate or verify compliance with emission limits.
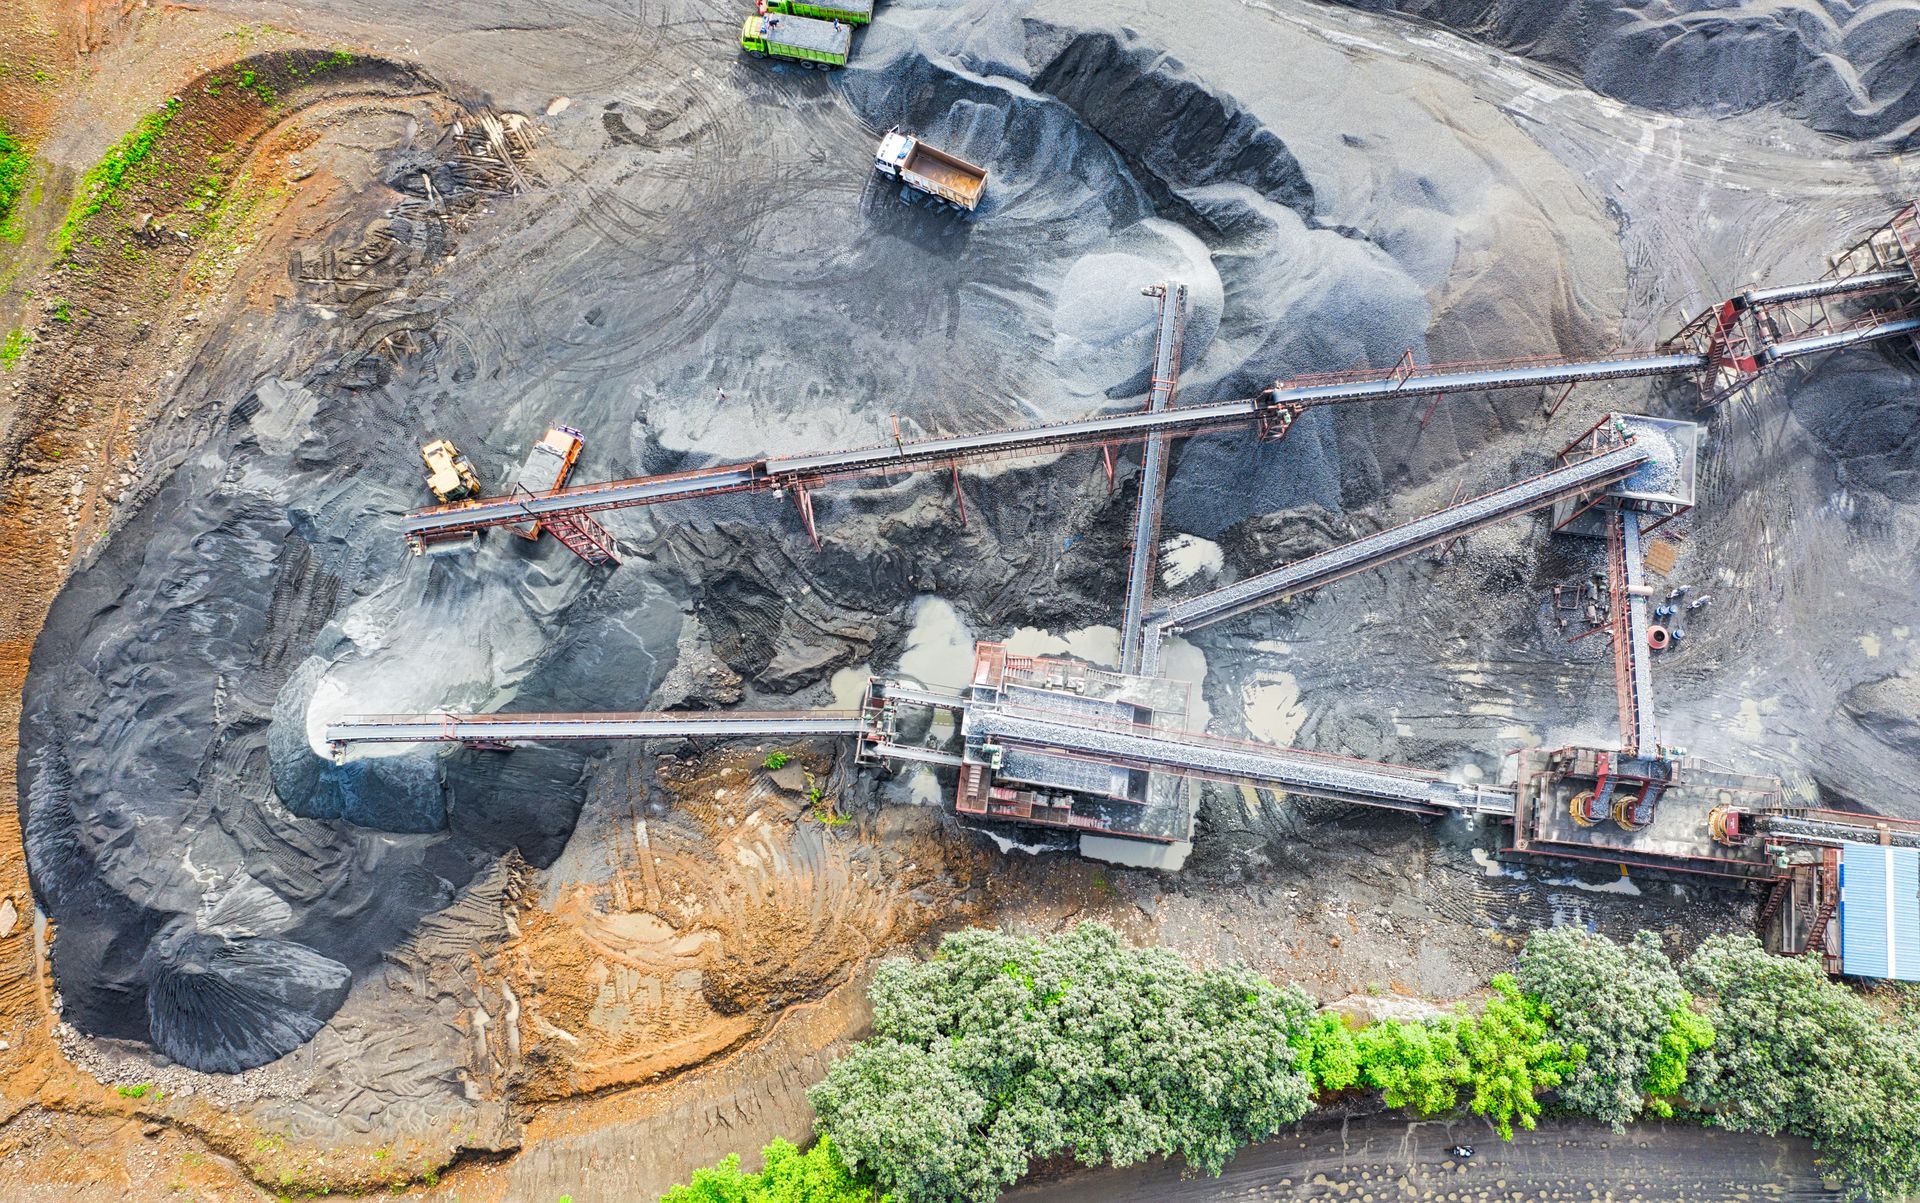
A stack emission always comes from a stationary source, that is, a fixed installation such as a cement works.
Stack emissions monitoring and regulatory compliance
Measuring stack emissions would make no sense without taking into account the regulatory framework that requires it and defines how it must be carried out, at what frequency and under which quality controls.
The European Union and the United States have different regulatory systems for the control of stack emissions, but they share a common logic: setting emission limits, requiring reliable measurement methods and establishing accreditation procedures that guarantee the quality of the data.
Industrial Emissions Directive and best available techniques
In the European Union, the Industrial Emissions Directive 2010/75/EU (IED) establishes the framework for integrated pollution prevention and control for the largest industrial installations. Its aim is to avoid, reduce and, as far as possible, eliminate pollution arising from industrial activity.
The core of this directive is the Best Available Techniques (BAT), understood as the most effective techniques for achieving a high level of protection for the environment as a whole, the application of which produces the BAT-AELs, or BAT-associated emission levels, which form the reference range against which emissions measured in the stack are compared. The directive was amended in 2024 through Directive (EU) 2024/1785, which extends its scope to emissions from livestock rearing and strengthens the role of emerging techniques, such as methane-inhibiting feed additives or real-time continuous monitoring sensors for enteric emissions.
EPA methods and CEMS performance specifications
In the United States, the EPA regulates CEMS through Title 40 of the Code of Federal Regulations (40 CFR), defining a CEMS as the set of equipment needed to determine the concentration or emission rate of a gas or particulate matter using analysers and a conversion equation. To guarantee that a CEMS is reliable at the time of installation, the EPA requires it to pass the Performance Specifications (PS), a set of 18 numbered protocols covering everything from opacity (PS-1) and SO2/NOx (PS-2) to particulate matter (PS-11), mercury (PS-12A/B) or gaseous hydrogen chloride (PS-19). Once installed, the system must also undergo periodic quality checks (such as the relative accuracy (RA) test against a reference method), terms set out in Appendix F to 40 CFR Part 60, which assess whether the data produced remain valid for determining regulatory compliance.
EN and ISO standards, accreditation and MCERTS
In Europe, the reliability of CEMS is guaranteed through EN and ISO technical standards that define reference methods and calibration and quality control procedures, complemented by national accreditation schemes. MCERTS (Monitoring Certification Scheme), developed in the United Kingdom, is one of the most widely recognised reference schemes. It certifies both continuous monitoring equipment and the personnel and bodies that carry out periodic tests, and has also been extended to ambient monitoring systems and low-cost sensors.
The MCERTS reference scheme, as a combination of technical standards and certification schemes, allows regulators to trust that an emission reading, whether from a CEMS or a periodic test, genuinely reflects the condition of the stack and not a measurement or calibration error.
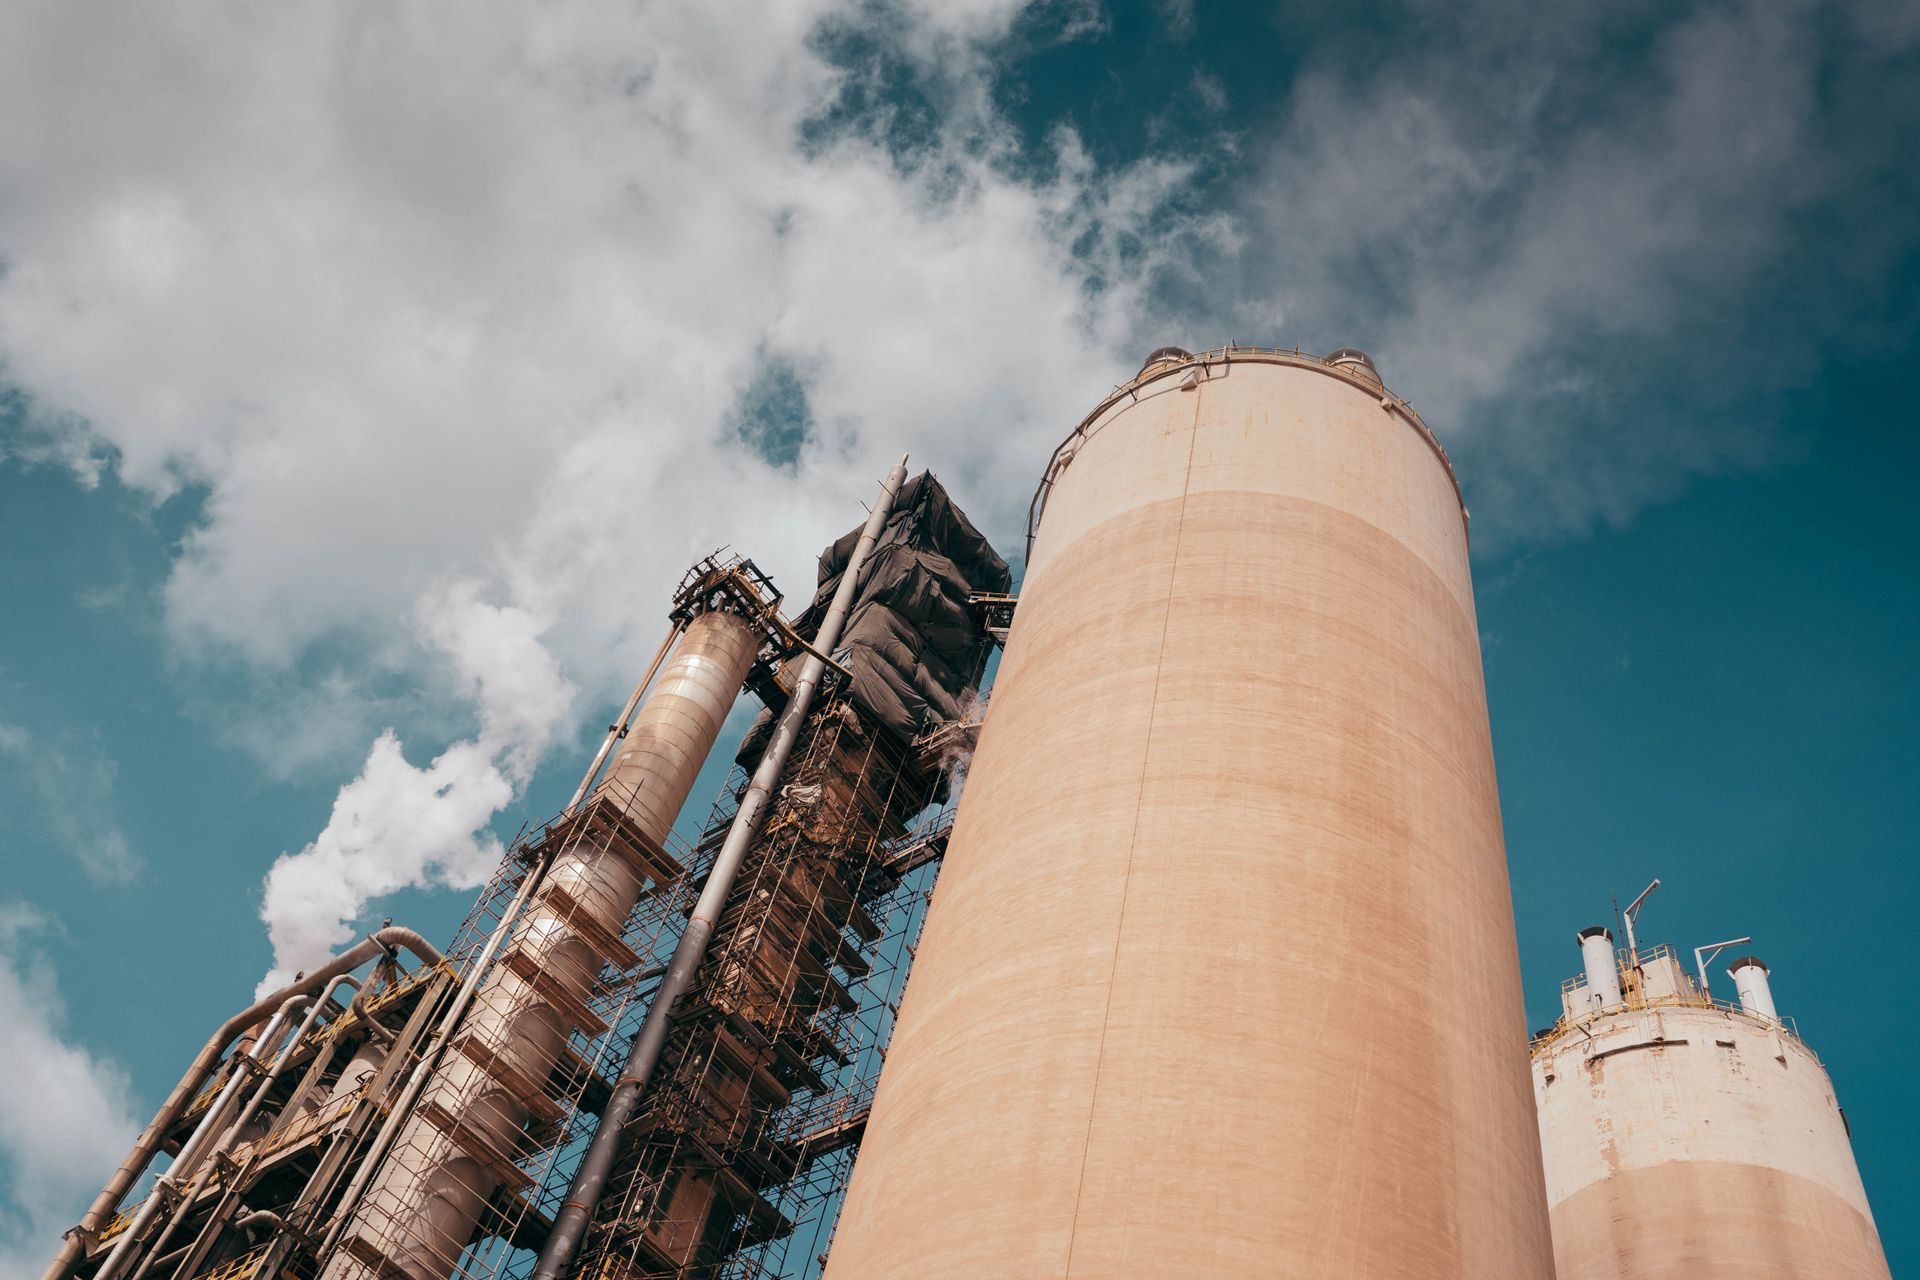
Industrial stack emissions, coming from a point source or stationary source, mean that the flue gas travels through an identifiable duct before reaching the outside air.
Periodic testing versus continuous emissions monitoring
Choosing between a periodic test and an automatic continuous monitoring system for stack emissions is not a question of which method is more suitable, but of knowing what the applicable regulation requires and what level of oversight each facility needs.
In fact, the regulation itself treats both approaches as valid. Continuous monitoring (CEMS) provides average concentrations over intervals of minutes or hours, while periodic sampling (monthly, six-monthly or annual, depending on the applicable emission standard) sends samples to the laboratory and obtains results days or weeks later.
| Criterion | Periodic tests | Continuous automatic monitoring systems (CEMS) |
|---|---|---|
| Time coverage | A representative snapshot at a specific point in time, at a monthly, six-monthly or annual frequency. | Uninterrupted recording, with data every minute or hour. |
| Cost | Lower initial investment, but a recurring cost for each sampling and laboratory analysis campaign. | Higher initial investment in equipment and conditioning, with operating cost spread over time. |
| Installation | Does not require permanent installation; only conditioning the emission source to take a representative sample. | Requires fixed installation integrated into the stack, with conditioning and data management (DAHS) systems. |
| Ability to detect episodes | Limited, since it only reflects conditions at the time of sampling, without detecting peaks outside that window. | High, as it allows peaks, trends and deviations to be identified in real time. |
| Regulatory use | Valid as a reference method at facilities with lower requirements, or to verify a CEMS. | Required at larger or higher-risk facilities, subject to performance specifications and periodic quality controls. |
| Maintenance needs | Low between campaigns; maintenance is concentrated around each individual test. | Ongoing, with calibration, quality controls and periodic verification against reference methods. |
When each method is used
Regulation does not impose a single universal approach, since larger facilities or those with greater environmental risk, such as power plants, incinerators or large cement works, tend to be required to install CEMS, while smaller facilities or lower-relevance sources can comply through periodic tests. There is also a third, intermediate option: portable analysers. These offer the same level of performance as a fixed unit but on a temporary basis, useful both for verifying that an installed CEMS is working correctly and for short evaluations lasting between three and five days.
Why both approaches are complementary
In practice, many facilities combine both methods. While a CEMS provides the continuous oversight needed for process control and early detection of episodes, periodic tests using reference methods serve to verify and validate the accuracy of the automatic system itself. This same logic of complementary layers, made up of a continuous solution plus periodic verification, is what later connects with the role of ambient and fenceline monitoring, which adds a third layer of oversight beyond the emission point.

Stack emissions are gases and particles released into the atmosphere through chimneys, ducts or outlets of stationary industrial sources.
From the stack to ambient air quality
Once a pollutant leaves the stack, its concentration measured at that point stops being the relevant variable. From that point on, what matters is how that mass of gas behaves in the atmosphere, that is, the ambient concentration that eventually reaches ground level, where people breathe.
How emission plumes disperse in the atmosphere
On leaving the stack, the gas rises to an effective height (the physical height of the duct plus the additional rise generated by the initial momentum of the gas and by the temperature difference with the surrounding air), and from there it moves horizontally in the direction of the wind while dispersing in the perpendicular plane through atmospheric turbulence.
This behaviour is not always the same. Depending on atmospheric stability and wind conditions, the plume can take different shapes, from a predictable cone-shaped pattern under moderate, stable wind conditions, to an erratic looping plume under turbulent conditions, or a fanning plume that spreads out horizontally near the ground when there is a thermal inversion and little wind.
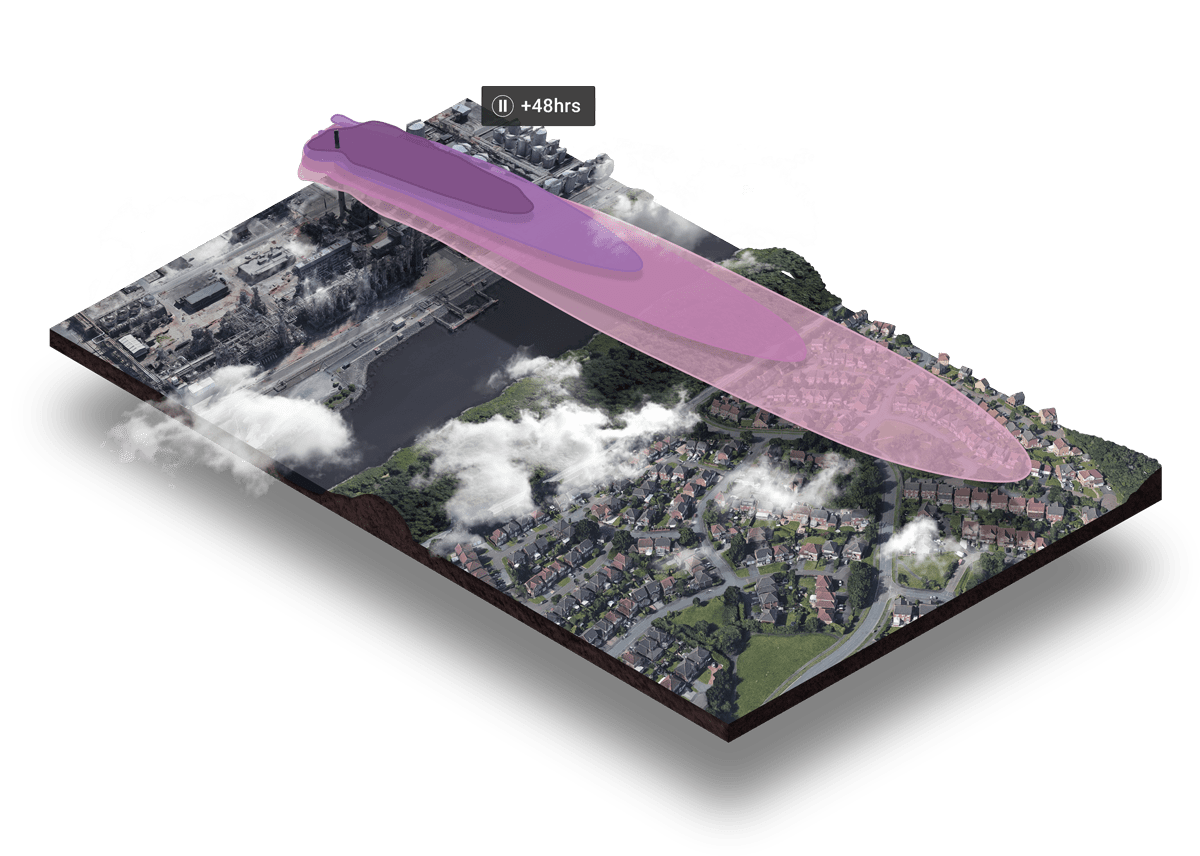
The algorithms, based on meteorological data, make it possible to trace the path of air pollution and identify its possible source. Infographic Envirosuite.
There is also a particularly relevant case for industry: when the gases emitted are cooler than the surrounding air and the plume shows negative buoyancy, descending directly towards the ground and increasing pollutant concentrations right in the vicinity of the emission source.
Why in-stack measurement alone does not describe ground-level exposure
These dispersion models (the most widely used being the Gaussian plume model) show that the final concentration at a given point depends on multiple variables external to the stack itself, such as wind speed and direction, atmospheric stability class, distance from the source, terrain topography and weather conditions at the time. As a result, two facilities with the same mass emission rate in the stack can generate completely different ground-level exposure levels, simply because of differences in the effective height of their stacks, local weather conditions or the surrounding terrain.
Stack emission concentration measured at the discharge point is a regulatory compliance metric, but it does not by itself reveal how much pollutant workers or nearby communities actually breathe.
Ambient and fenceline monitoring as complementary evidence
The gap between what is measured in the stack and what happens at ground level is precisely what is covered by fenceline monitoring. Unlike a CEMS, which monitors a specific, fixed point, fenceline monitoring deploys a network of stations around the facility that makes it possible to know what is actually happening in the surroundings, detecting both the impact of already dispersed channelled emissions and that of fugitive or diffuse sources that no CEMS could capture.
The oversight layer provided by ambient and fenceline monitoring does not replace regulatory in-stack measurement; instead, it provides complementary evidence. It relates ambient concentrations to weather conditions at the time, making it possible to link the detection of specific peaks to particular plant activities. In this way, it gives industry and nearby communities a much more complete picture of the real impact of industrial activity on the air quality they breathe.
Fenceline monitoring provides the context that in-stack measurement cannot offer, relating emissions, weather conditions and the impact on the air breathed by nearby communities.
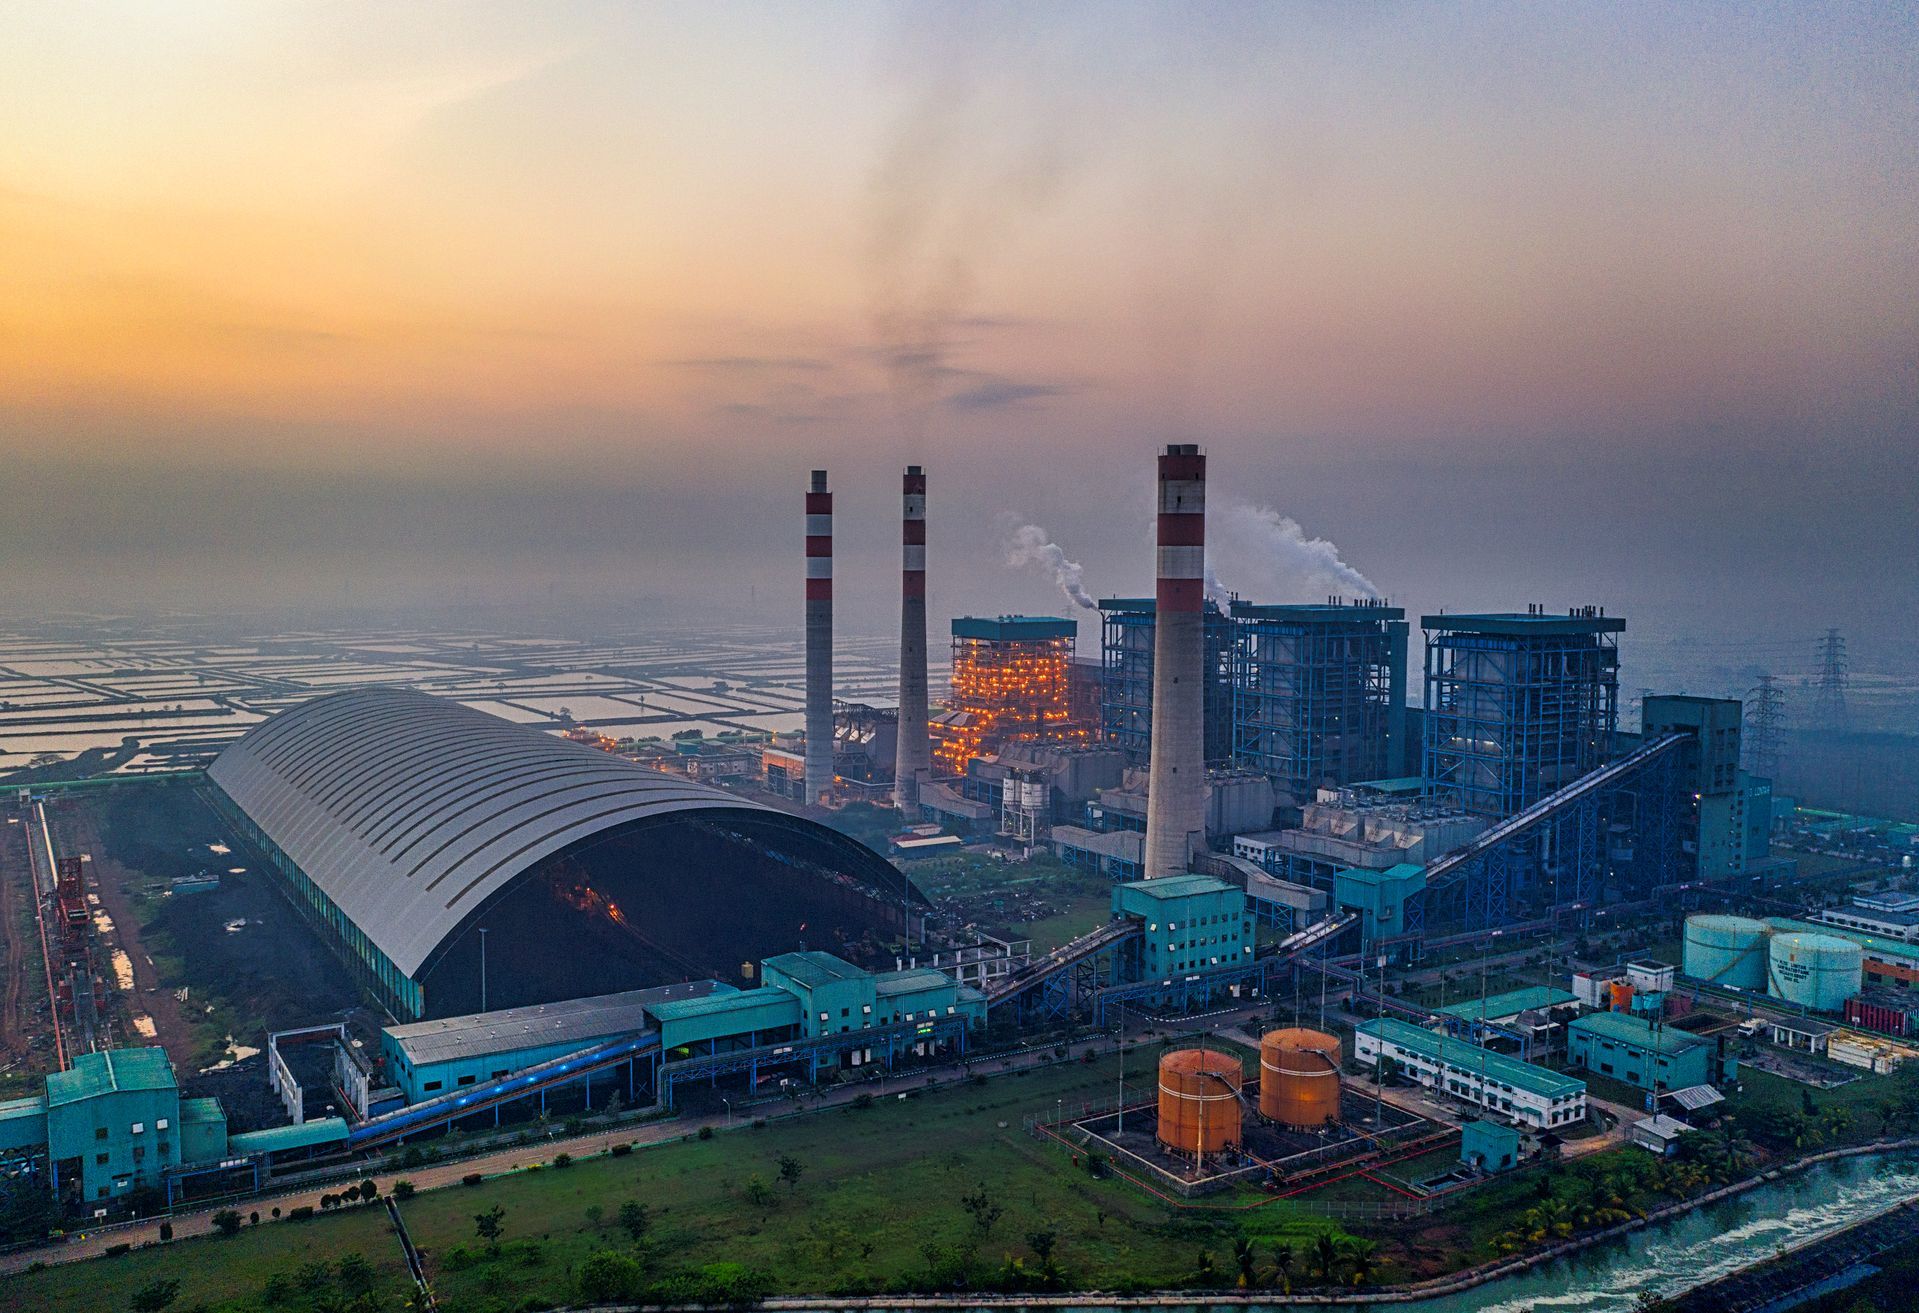
Stack emissions, or channelled emissions, are mixtures of gases and particles generated in an industrial process and released into the atmosphere through a defined duct or discharge point, the stack.
How to improve stack emissions management
Beyond complying with the emission limit value, the data generated by in-stack measurement can become an active tool for improving the industrial process itself, as well as the reliability of the measurements and the understanding of the facility’s real environmental impact.
Using emissions data to optimise industrial processes
Having accurate, continuous emissions data serves to demonstrate regulatory compliance, but it also makes it possible to optimise the production process itself, improve energy efficiency and, as a result, reduce operating costs. A CEMS that records real-time variations in NOx, SO2 or CO can flag combustion inefficiencies, dosing mismatches in abatement reagents or deviations in raw material quality before they turn into a regulatory exceedance, making it possible to act on the cause of the problem and not only on its consequence. This capacity for anticipation is what turns emissions monitoring from a reactive obligation into a predictive process control tool.
Quality control, calibration and data traceability
An emission reading is only useful if it is reliable, and that reliability is guaranteed through standardised quality control procedures. In Europe, standard EN 14181:2015 defines three Quality Assurance Levels (QAL):
| Element | Objective | When it is carried out |
|---|---|---|
| QAL1 | Verify that the automatic measuring system (AMS) is fit for use and meets performance requirements before it is installed. | Before the equipment is installed. |
| QAL2 | Calibrate the AMS by comparing its readings with reference methods to guarantee the accuracy of the data. | After installation and, subsequently, every three to four years (depending on the facility). |
| QAL3 | Continuously check that the equipment maintains its stability and that zero and span drift remain within acceptable limits. | Throughout the operation of the system. |
| Annual Surveillance Test (AST) | Confirm that the calibration obtained under QAL2 is still valid and that the system remains reliable. | Annually. |
In the United States, an equivalent scheme is set out through the performance specifications and relative accuracy tests contained in 40 CFR, while in countries such as Chile a specific QA/QC protocol requires documented linearity tests, gas calibrations or absolute correlation audits to guarantee the traceability of every reported reading.
Integration of stack, weather and air quality data
The final step towards advanced emissions management consists of integrating stack data with weather information and with ambient air quality networks, rather than treating them as isolated sources of information. Real-time dispersion models combine emission data from continuous monitors with weather data from surface stations to simulate, on an hourly basis, how the pollution plume behaves and what concentration can be expected at ground level. This integration allows industry to correlate a peak detected at a fenceline station with the wind and atmospheric stability conditions at the time, and relate it, where relevant, to a specific variation recorded by the stack’s CEMS, closing the loop between what is emitted, how it disperses and what real impact it has on the air quality breathed by workers and nearby communities.
How Kunak complements stack emissions monitoring
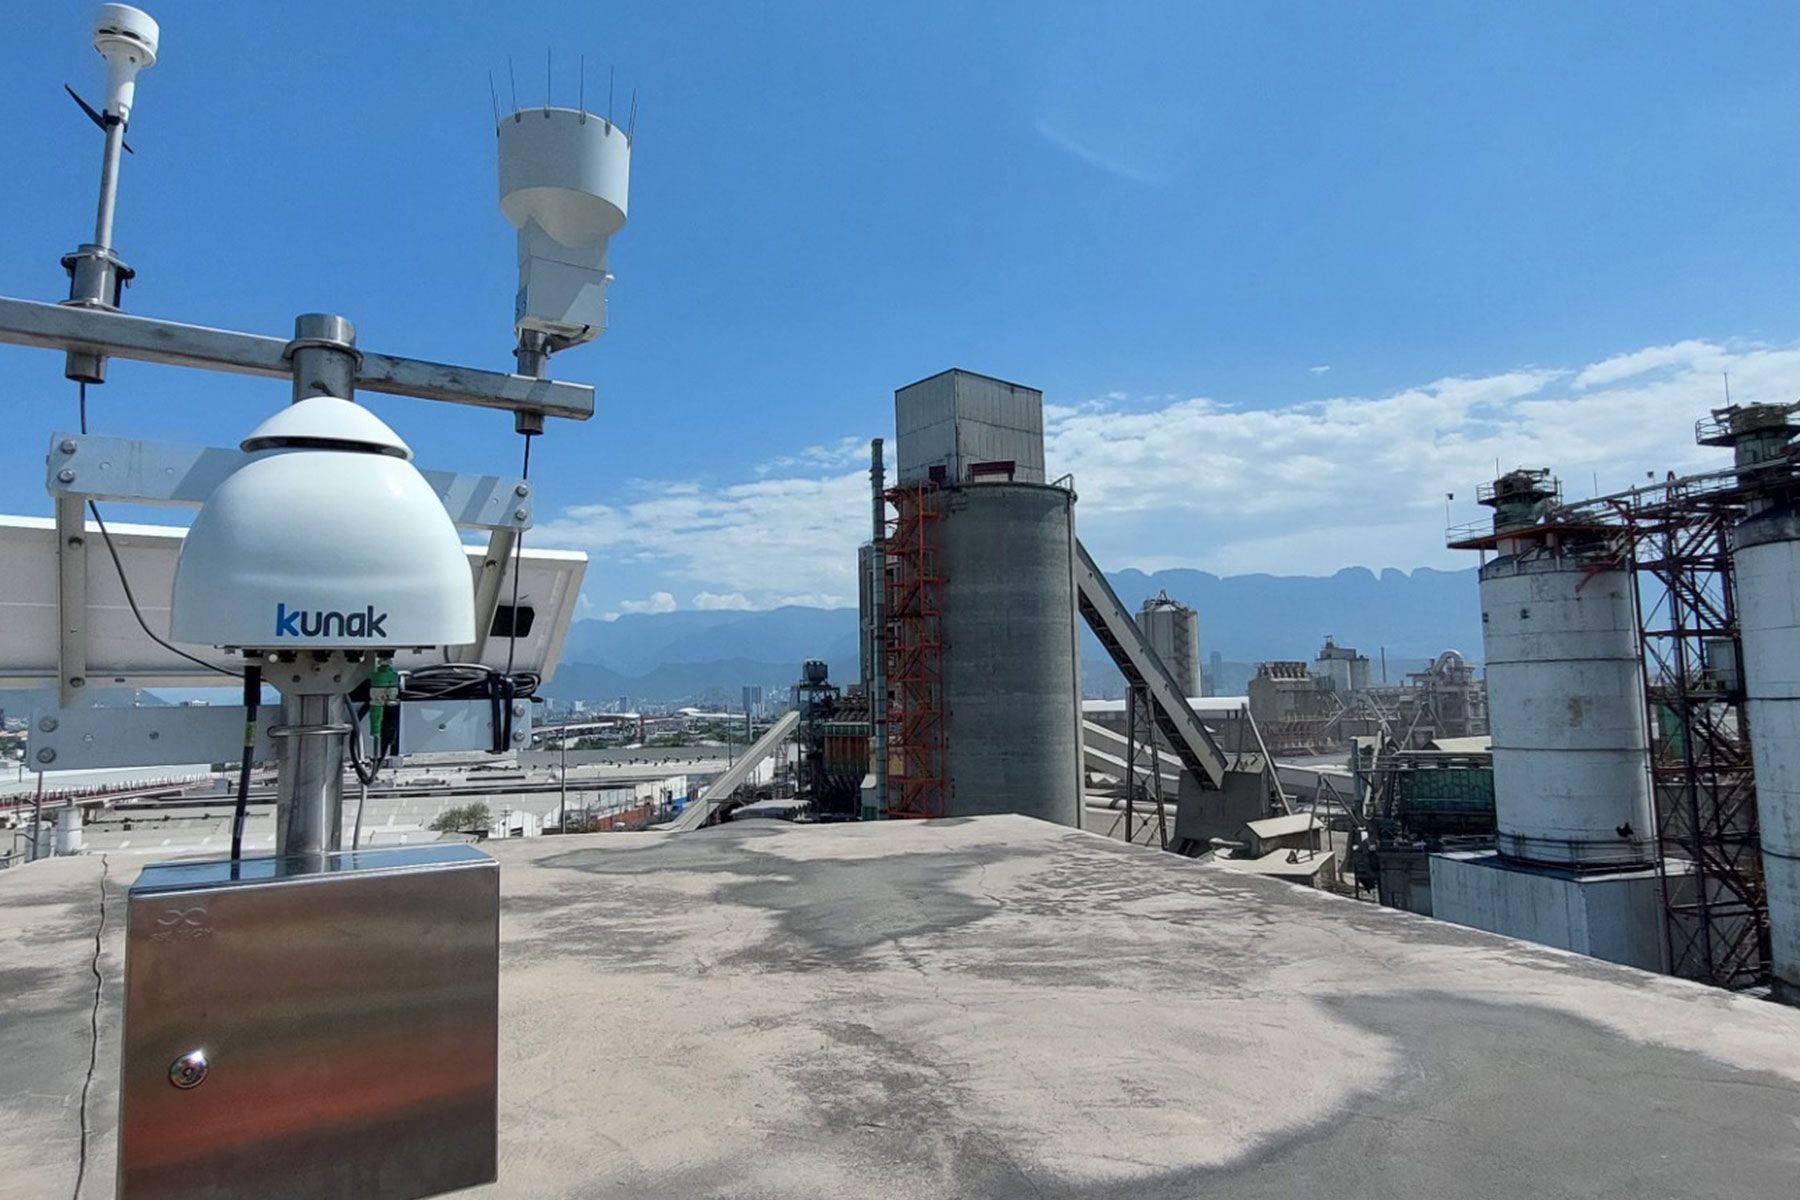
Kunak’s stack emissions monitoring stations do not replace the regulatory tests carried out in the stack, nor are they equivalent to a CEMS installed in the outlet duct. Since they do not measure the concentration or flow rate of the flue gas at the discharge point, they cannot be used as a method for complying with the emission limit value set in the environmental permit. Their role is different and complementary, providing visibility into what happens outside the stack, in the surrounding environment where those already-dispersed emissions end up affecting both people and ecosystems.
A network of Kunak AIR Pro stations deployed around an industrial facility makes it possible to know the real concentration of pollutants in the ambient air, that is, the scale of the impact on the surroundings that ultimately determines the exposure of workers and communities. This is, however, a figure that can differ considerably from the concentration measured in the stack, depending on the weather and the distance from the emission source.
Unlike a CEMS, whose oversight takes place at a single fixed point, fenceline monitoring covers the entire perimeter of the industrial facility, detecting both the impact of already-dispersed channelled emissions and that of fugitive or diffuse sources that no in-stack system could capture.
Fenceline stations record concentration peaks in real time, right where their effects occur, at ground level. This is especially relevant during episodes of negative plume buoyancy or thermal inversion, in which the pollutant can concentrate near the source instead of dispersing at height.
Likewise, ambient data measured in the field are used to validate and calibrate dispersion models (such as the Gaussian plume model) that predict how the plume should behave according to weather conditions, by comparing the theoretical prediction with the pollutant concentration actually recorded.
Kunak AIR stations, by integrating weather sensors alongside sensors for the various atmospheric pollutants, correlate each concentration peak with wind direction and speed at each moment, which makes it easier to identify which specific source an emission comes from when there are several potential emission sources in the area.
A fenceline network, such as those set up by Kunak, can be oriented specifically towards sensitive receptors (residential areas, schools or nearby healthcare facilities) to ensure that oversight is not limited to regulatory compliance at the emission source, but also responds to the real protection of public health in the area surrounding the monitored industry.
An example of this focus on sensitive receptors is the Nama Water Services project in Oman, where 28 Kunak AIR Pro stations fitted with H2S, NH3 and VOC sensors monitor the odours emitted by several wastewater treatment plants located in different cities across the country, specifically to protect nearby populations. In a more urban setting, Bilbao City Council has deployed a network of 41 Kunak AIR Pro stations with different configurations depending on location, including additional probes to assess the impact of the Low Emission Zone and provide constant air quality oversight in the most sensitive neighbourhoods and areas of the city.
When an odour complaint or a specific pollution incident occurs, having a historical record of ambient data with precise time resolution makes it possible to reconstruct what happened and correlate it with weather conditions and plant operation at the time, providing objective evidence to industry, authorities and the affected community alike.

Industrial stack emissions usually contain a variety of pollutants, from nitrogen and sulphur oxides to particulate matter and volatile organic compounds.
Frequently asked questions about stack emissions
What are stack emissions?
Stack emissions, or channelled emissions, are mixtures of gases and particles generated in an industrial process and released into the atmosphere through a defined duct or discharge point, the stack.
They always come from a stationary source, that is, a fixed installation such as a power plant, a refinery, a cement works or an incinerator, whose flue gas travels through a duct before reaching the outside air. This channelling turns the stack into a clearly locatable point source, which allows regulation to require its oversight whenever technically feasible, since it is far easier to quantify and control an identifiable duct than a leak dispersed across the whole plant. There is not always a direct correlation, however, between the emitting stack and the activity that originates it, since a single stack can collect gases from several different processes within the same industrial facility.
Which pollutants are commonly found in industrial stack emissions?
The composition of stack emissions depends directly on the industrial process and the fuel used. Nitrogen oxides (NOx) form mainly during combustion, from the nitrogen in the fuel itself or from the air used to burn it.
Sulphur dioxide (SO2) depends almost exclusively on the sulphur content of the fuel, while carbon monoxide (CO) is generated by incomplete combustion. Carbon dioxide (CO2) is the main greenhouse gas of industrial origin, concentrated above all in the power sector.
Particulate matter, classified by size (PM10, PM2.5), comes both from combustion and from calcination processes or raw material handling. Non-methane volatile organic compounds (NMVOCs) are organic compounds other than methane capable of generating photochemical oxidants. These are joined by process-specific pollutants, such as sulphuric acid, chlorine, ammonia or heavy metals like mercury, arsenic, cadmium, chromium, lead or nickel, coming from the fuel or the raw materials.
How are stack emissions measured?
Stack emissions are quantified through two broad, complementary approaches. Periodic tests consist of taking samples of the flue gas at specific points in time, at a frequency set by the applicable regulation, using standardised reference methods for each pollutant, including isokinetic sampling for particulate matter, which adjusts the suction velocity to the actual gas velocity in the duct. Continuous automatic monitoring systems (CEMS) monitor and record emissions without interruption, integrating gas analysers, volumetric flow rate measurement and a data management system. These systems can be extractive, when they analyse the sample outside the stack, or in situ, when the measurement is carried out directly inside the duct.
In both cases, the measured concentration must be combined with the volumetric flow rate of the gas to obtain the mass emission rate, the quantity that is actually compared against the regulatory emission limit value, whether through a one-off test or certified continuous monitoring in line with performance specifications.
What is the difference between stack emissions, fugitive emissions and diffuse emissions?
Stack emissions travel through a fixed, identifiable duct, which allows them to be measured directly at the outlet point through periodic tests or CEMS, and compared against an emission limit value defined in the environmental permit.
Fugitive emissions, by contrast, escape without control from components such as valves, flanges, seals or storage tanks, without passing through any duct, so they cannot be measured with the same methods and require specific detection systems, such as LDAR programmes (Leak Detection and Repair).
There is also a third category, diffuse emissions, originating from extensive surfaces (material stockpiles or loading areas) with no defined escape point, and which also cannot be channelled towards a stack.
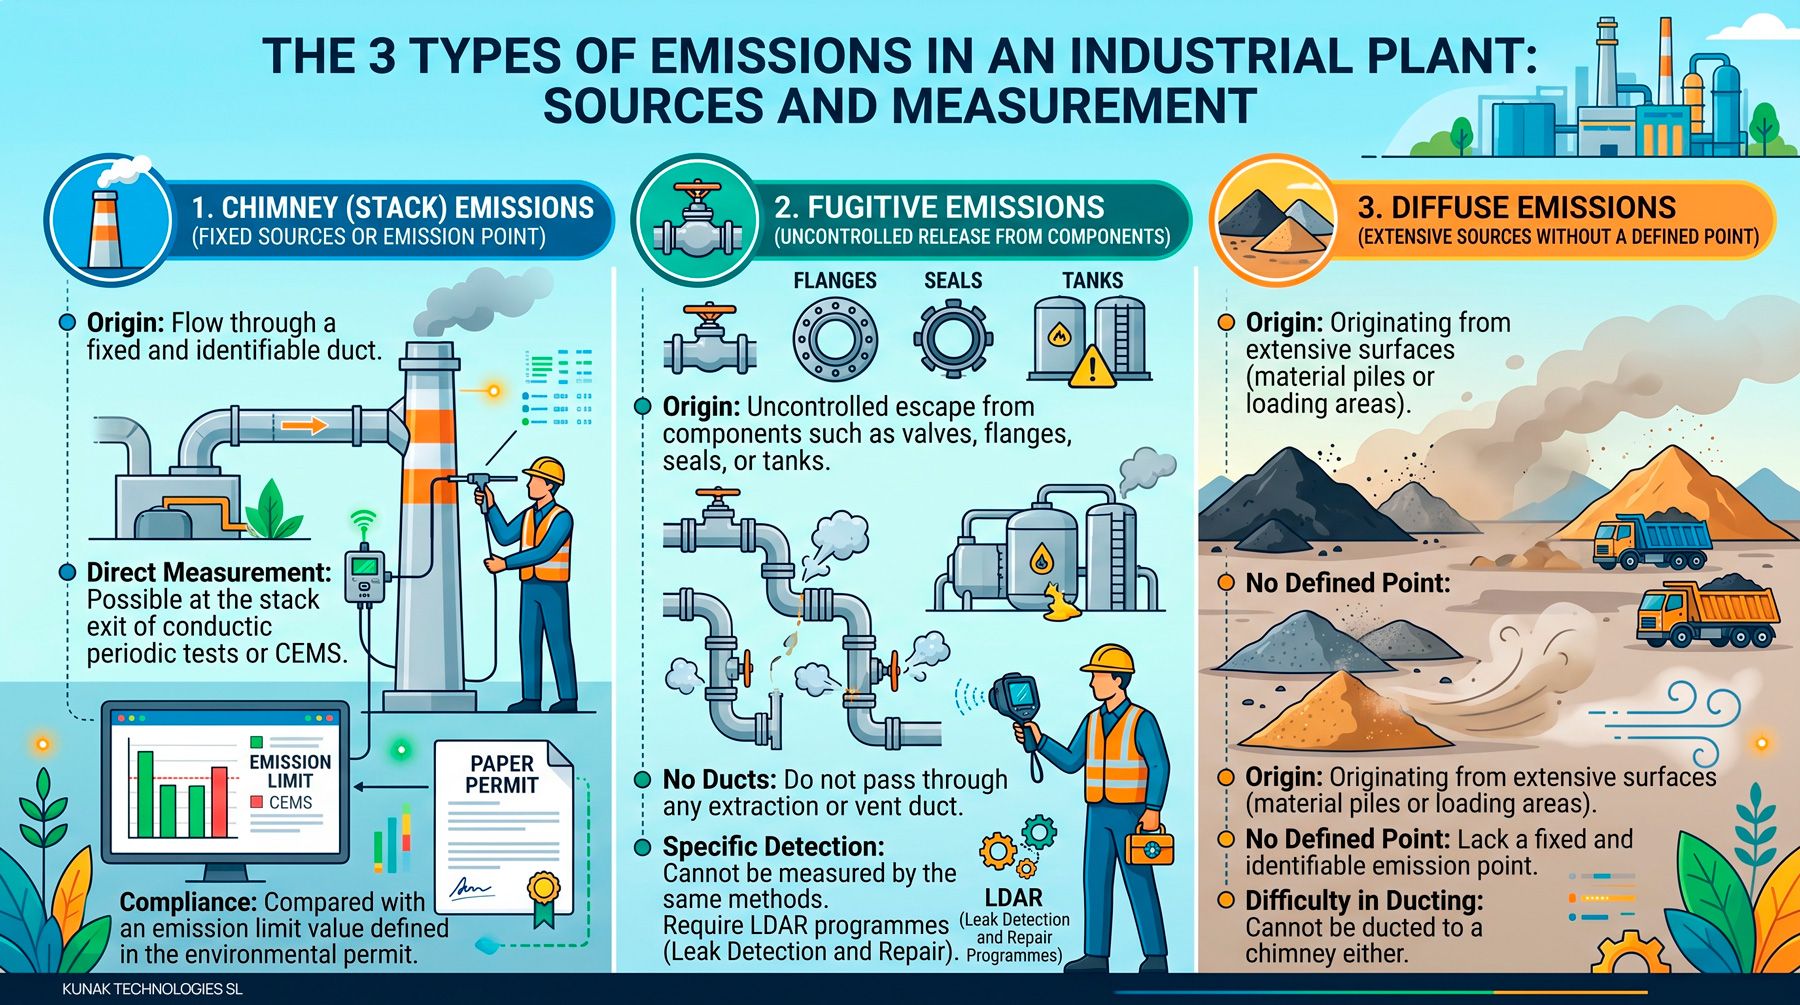
Infographic: Differences between stack emissions, fugitive emissions and diffuse emissions – Kunak
This distinction is key from an environmental management standpoint because each type of emission requires a different oversight strategy. While channelled emissions are controlled with CEMS or periodic tests in the duct itself, fugitive and diffuse emissions need fenceline monitoring so they can be detected and accurately quantified in the surroundings of the facility.
Can air quality sensors replace a CEMS?
No. A regulated CEMS directly measures pollutant concentration and, in certain cases, the volumetric flow rate of the gases in the stack itself, and must pass performance specifications and quality controls defined by the applicable regulation, such as the EPA’s Performance Specifications or the EN 14181 standard in Europe.
Air quality monitoringControlling air quality is an essential task in order to enjoy optimal environmental conditions for healthy human development and to keep the environment i...
Read more stations do not carry out that measurement at the discharge point, so they have no legal standing to demonstrate compliance with the emission limit value set in a facility’s environmental permit. Their role is complementary: providing visibility into the real impact of those emissions once dispersed in the atmosphere, monitoring the industrial fenceline, detecting ground-level episodes, testing dispersion models and relating ambient concentrations to weather conditions at the time. It is an oversight layer that is especially useful for protecting workers and nearby communities, supporting investigations into complaints or specific episodes, and providing objective evidence about real air quality, but it never replaces the regulatory test or the CEMS installed in the stack.
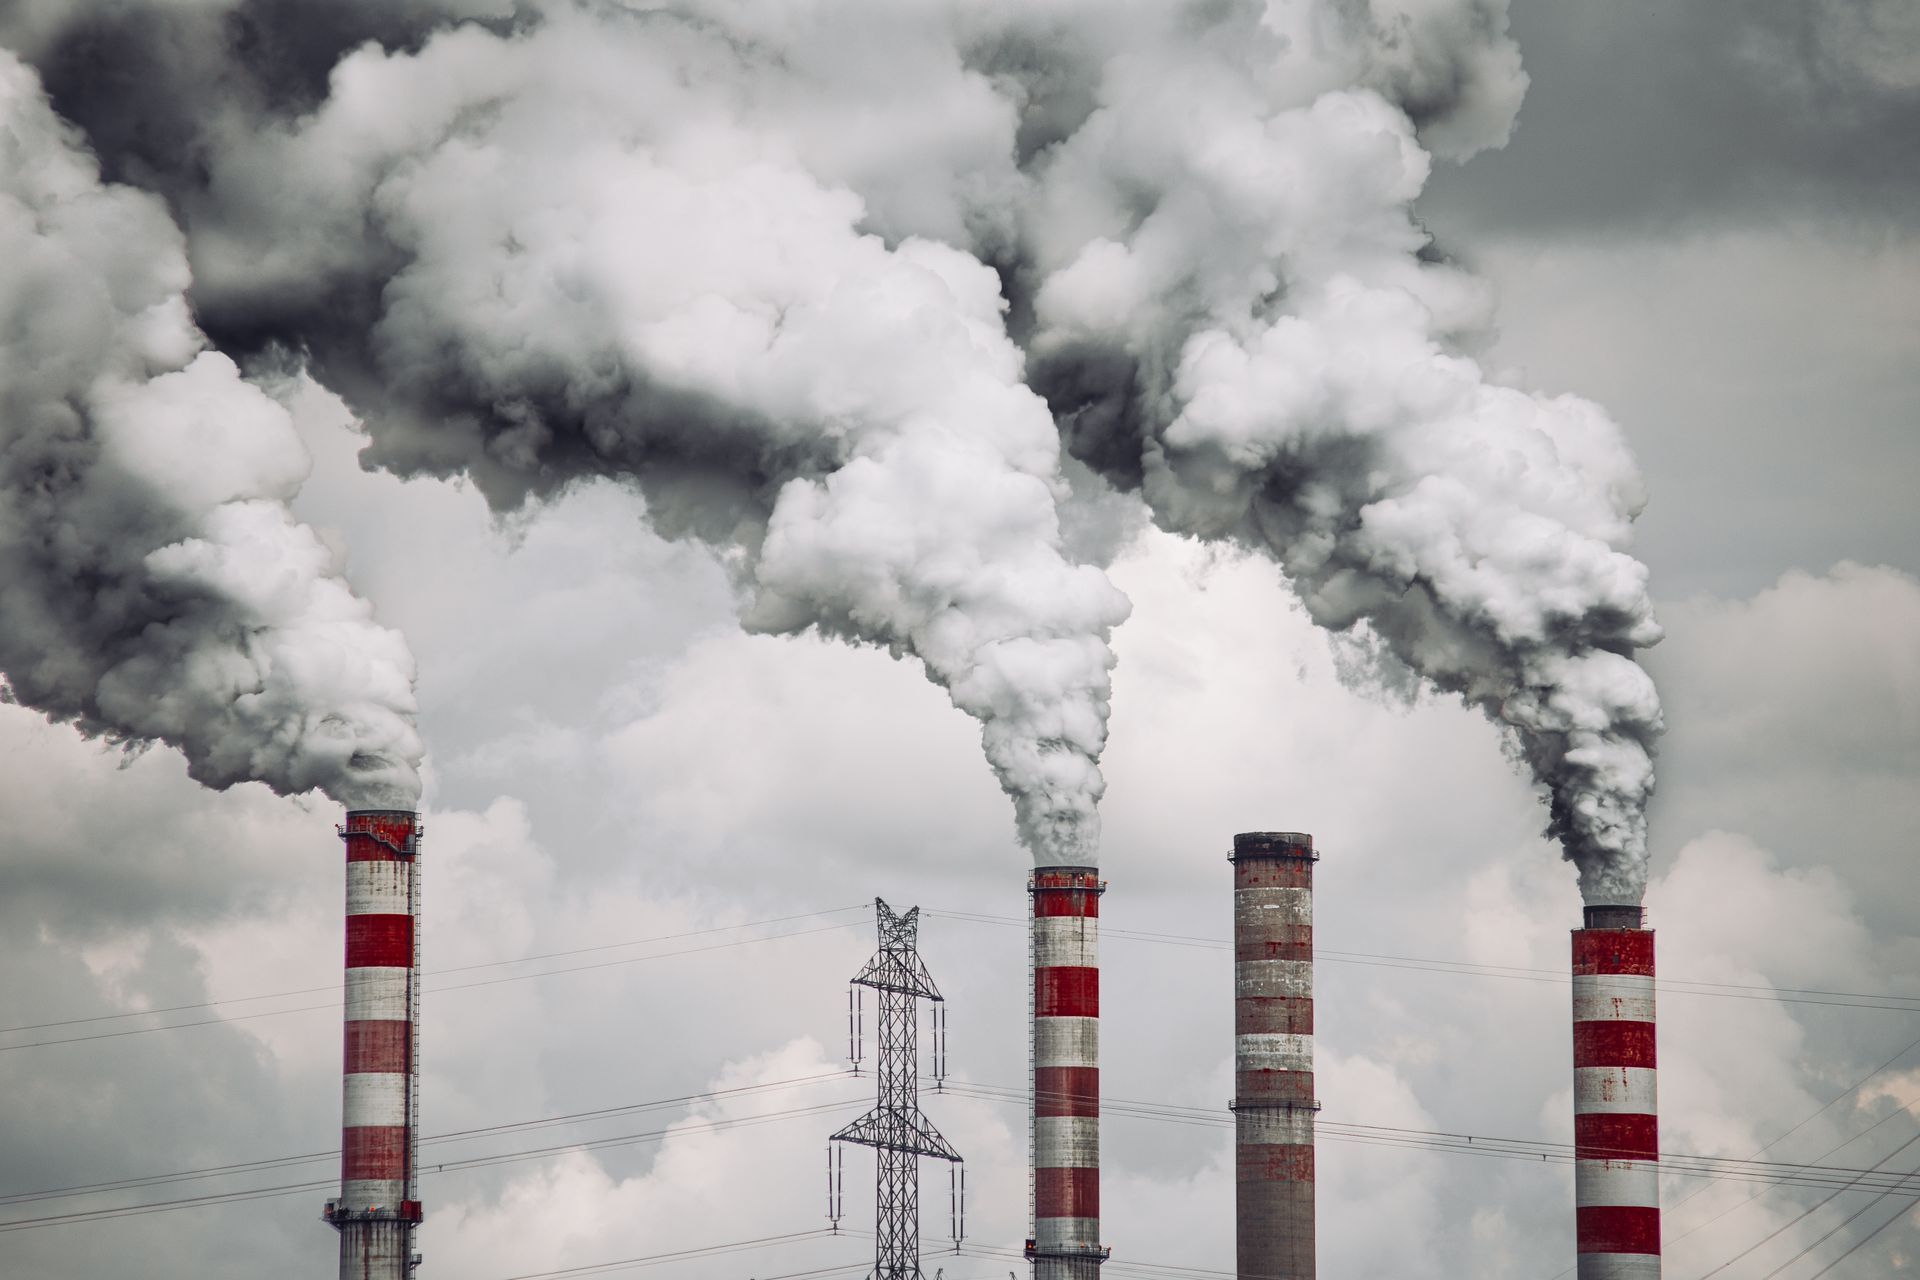
Channelling stack emissions is key from a regulatory standpoint, since regulation requires emissions to be conducted through a stack whenever technically possible.
Conclusion: combining source measurement and environmental monitoring
Periodic in-stack tests and continuous automatic monitoring systems (CEMS) define exactly what the facility releases at its discharge point, at what concentration and with what mass emission rate, comparing it against the emission limit value set in its environmental permit. This source measurement is, and will remain, the legal basis of regulatory compliance for stationary sources, precisely because it provides a certified, traceable and comparable reading against the performance specifications required by the applicable regulation.
However, that reading alone does not explain what happens after the pollutant leaves the stack. Plume dispersion in the atmosphere depends on weather conditions, topography and the effective height of the source, factors that determine whether that emission translates into a significant ground-level impact or dilutes without relevant consequences. In that gap between what is emitted and what is ultimately breathed is where ambient and fenceline monitoring networks add their value. While they do not replace the regulatory test or the CEMS, they make it possible to observe how these emissions behave once dispersed, correlate them with wind direction and speed, and detect real episodes in the surroundings of the facility.
Understanding stack emissions fully therefore requires combining both perspectives. Source measurement certifies what the source releases, while environmental monitoring shows how that emission affects the air breathed by workers and nearby communities. This dual view is what allows industry to move from reactive compliance to a genuinely informed environmental management approach.
 How to choose an air quality sensor: criteria for getting your project right
 Tunnel air quality monitoring: sensors, ventilation and safety
 Fugitive emissions management: detection and control of industrial leaks
 Fenceline monitoring at industrial sites: continuous monitoring and emission detection
 Near-reference monitoring: advanced accuracy in air quality measurement