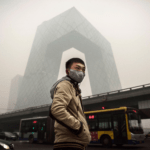
New York, the city that never sleeps, sometimes takes on a dreamy appearance when shrouded in fog. Nothing could be further from reality for one of the largest and most densely populated cities in the world. More than a scene from a film, with the action rising through the mysterious fog that cuts through its urban skyline, it is a toxic cloud that threatens the health of its inhabitants.
Such dense fog is the result of particles suspended in the air which add their toxicity to polluting gases, creating a dangerous combination and a real threat breathed in by its inhabitants every day.
This environmental situation is commonplace within the urban environment, particularly in districts where Latino and African American communities reside, and it becomes more oppressive every summer. During this season the fog becomes more persistent due to the high temperatures and intense solar radiation of that time. These factors lead to a deterioration of air qualityAir quality refers to the state of the air we breathe and its composition in terms of pollutants present in the atmosphere. It is considered good when poll...
Read more in summer that directly affects the health and safety of its residents.
Air quality in New York can vary considerably depending on the time of year, weather conditions and human activity. Clean air cannot be guaranteed without the aid of constant surveillance through reliable, real-time monitoring of the New York air.
Prolonged exposure to poor air quality environmental conditions can exacerbate chronic diseases such as asthma, and lead to cardiovascular and respiratory conditions, underlining the importance of constant air monitoring in order to take preventive action.
More than one in three U.S. citizens live in places with an unhealthy level of air pollution. State of Air Report 2023.
Although, in general terms, New York City has made significant strides in improving air quality in recent decades by decreasing the proportion of pollutants, it still faces major challenges. It is still considered among the most ozone-polluted cities in the country.
Air Quality Innovation in Just 1 Click
Stay informed about the air you breathe!
Subscribe to our newsletter to receive the latest updates on environmental monitoring technology, air quality studies, and more.
What is happening to the air quality in New York?
The air quality in New York has long been a constant concern over the years due to its high population density, vehicle traffic and industrial emissions. In addition, it tends to be worse during the summer months, particularly between June and August. This time of the year is critical as a result of several factors that contribute to the deterioration of air quality:
High temperatures and solar radiation
During the summer, high temperatures and intense solar radiation increase the formation of tropospheric ozone (O3). Ground-level ozone is a respiratory irritant and can cause significant health problems.
Summers in New York are warm and sunny, conditions that favour the chemical reaction that produces tropospheric ozone. In addition, stable atmospheric conditions during the summer can trap pollutants near the ground, increasing the concentration of smogSmog, beyond that dense fog
Smog is a mixture of air pollutantsAir pollution caused by atmospheric contaminants is one of the most critical and complex environmental problems we face today, both because of its global r...
Read more that accumulate in the atmosphere, especially in urban areas. This phenomenon is character...
Read more.
Stable atmosphere conditions
Lack of wind and high atmospheric pressure, along with the atmospheric stability at the time, can trap pollutants near the ground, increasing concentrations of particulate matter and harmful gases.
Increased human activity
The increase in vehicle traffic due to summer holidays and an increase in industrial activities contribute to higher emissions of pollutants such as NOx, CO, and particulate matter in suspension (PM2.5 and PM10).
Weather events
Heat waves are more frequent in summer and can exacerbate poor air quality. High temperatures intensify the chemical reactions that form pollutants and can aggravate health problems related to poor air quality.
In short, summer is the time of year when the air quality in New York is generally worse, due to a combination of high temperatures, increased solar radiation, stable atmospheric conditions, and increased human activity. When these factors are taken together, it is the most significant time of the year, as they contribute to the creation and accumulation of atmospheric pollutants.

New York at dusk
What is deteriorating New York’s air quality?
The air conditions New Yorkers experience vary markedly by urban area and district. In general, throughout the city, the source of pollution lies in a combination of several factors:
Traffic density
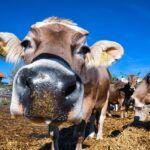
Although electric buses and taxis have been introduced in recent years, fossil fuel-powered cars, trucks and buses are still a significant source of air pollution in New York, emitting NO2, CO and particulate matter in suspension. In addition, the traffic is usually heavy, favouring high levels of these pollutants.
Industry and construction
Both industrial and construction-related activities release a variety of pollutants, including particulate matter and volatile organic compounds (VOCs), which can contribute to the creation of ozone at ground level.
Heating and energy
The use of heating systems that burn fossil fuels, as well as power plants that use coal, oil or natural gas, contribute significantly to SO2, NO2 and suspended particulate matter emissions.
Weather conditions
Weather conditions play a crucial role in air quality. For example, heat waves and lack of wind can increase concentrations of ozone and suspended particles.
Natural events
A variety of natural events, such as wildfires occurring in nearby areas, can affect air quality in New York by transporting smoke and suspended particles on the wind. In addition, during the spring and summer seasons pollen can affect air quality.
The PM2.5 decreased by 23% in New York air pollution during the Covid-19 health lockdown. Based on the data, a five-year improvement plan was modelled, and the conclusions reached were that the benefits of living with clean air would imply a decrease in pre-term births, low birth weight at term, infant mortality, incidence of childhood asthma, hospital admissions and emergency room visits for childhood asthma and autism spectrum disorder, in addition to adult mortality. Perera, F. et al., (2021).
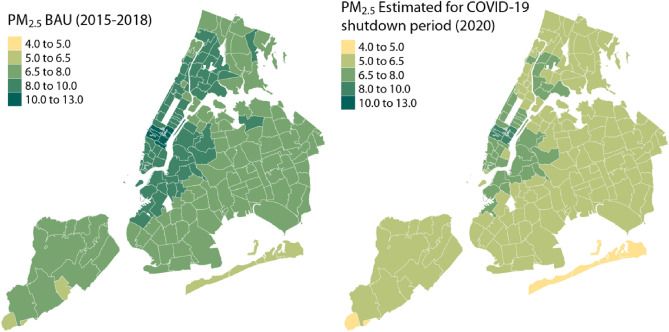
PM during Covid-19 shutdown
Areas of New York with the worst air quality
The areas of New York with the worst air quality are those that are close to emission sources such as industries, those with significant traffic presence and those with a lack of green areas. The most harmful elements are concentrated in specific New York districts, and they are the same ones that report a worse Air Quality Index:
Bronx
This is where some of the worst air in the city is breathed. A large number of roads converge here, in addition to a significant industrial presence and numerous logistics areas for storage and distribution, increasing the number of heavy vehicles on the road.
Manhattan
This is where ozone and nitrogen dioxide reach the highest levels due to the continuous significant influx of vehicles. In addition, in Chinatown and the East Village there is the added drawback of having fewer green spaces such as parks and gardens, contributing towards further worsening the air quality in this famous urban area.

Brooklyn bridge in New York
Brooklyn
As one of the districts that has developed the most, it has a larger population that suffers from the effects of lower air quality as a result of industrial activity and heavy traffic of vehicles.
Queens
Its proximity to large industrial plants and the significant transport network that moves its manufactured products contribute towards its poor air quality. The Jamaica area, in addition, due to its proximity to JFK airport and an extensive road network, has one of the least clean airs in the city.
Staten Island
To vehicle traffic and its proximity to industrial facilities, the significant maritime traffic has to be added in in this county located in the south-west part of the city. Although it is the least populated New York district, it has one of the worst levels of urban air quality.
The main causes of smog in New York
Air quality in New York is a persistent problem and therefore an ongoing matter of concern. Episodes of smog reach such a magnitude that they affect millions of residents. Despite improvements over the past decade, levels of certain air pollutants still pose a significant threat to public health.
Among the most harmful pollutants causing smog are:
Ozone (O3)
It is one of the main components of smog and a serious problem during the summer months. It forms when nitrogen oxides (NOx) and volatile organic compounds (VOCs) react with sunlight.
Suspended particles (PM2.5 and PM10)
These small particles suspended in the air can penetrate deep within the lungs and cause serious respiratory and cardiovascular problems.
Nitrogen dioxide (NO2)
Its presence is increased directly through emissions from fossil fuel-driven vehicles and industrial activities.
Sulphur dioxide (SO2)
This comes mainly from the combustion of fossil fuels in power plants and heating.
Carbon Monoxide (CO)
Associated with vehicle emissions and many industrial processes.
Taken together, these anthropogenic pollutants present in the air are the origin of that dense, visible fog known as smog. Depending on its origin, smog can be considered photochemical or industrial.
Photochemical smog
This type of smog is formed when nitrogen oxides (NOx) and volatile organic compounds (VOCs) combine, activated by sunlight. The result of this chemical reaction produces tropospheric ozone (O3) and other oxidising compounds.
Photochemical smog is most common in urban areas with high traffic density and industrial activity, particularly in places with hot, sunny weather. It appears as a layer of brown or greyish mist.
This type of smog is the one that affects New York City most, due to the combination of traffic emissions, industrial activity and power plant use. These factors are compounded by favourable weather conditions, which are common during the New York summer.
While summer ozone is sensitive to NOx, ozone is more reactive to VOCs present during New York’s winter and spring days. Blanchard, C. et al., (2019).
Industrial smog
This type of smog is mainly produced by burning coal and other fossil fuels that release sulphur dioxide (SO2) and suspended particles.
It is associated more closely with cold climates and appears as a layer of grey or black fog. It was characteristic of industrial cities like New York during the Industrial Revolution.
This scenario changed due to the fact that the city, in recent decades, has experienced a significant reduction in industrial emissions, thanks to stricter environmental regulations and the use of cleaner technologies.
To solve the incidence of photochemical smog in New York City, particularly during the summer months, when it occurs more frequently, it is essential to implement effective policies and use clean technologies. In addition to maintaining constant air surveillance through real-time monitoring. This mitigates the problem, while protecting public health and the environment.

How is air quality in New York evaluated?
The city has a network of air quality stationsAir quality stations are systems dedicated to monitoring atmospheric pollution, essential for measuring the concentration of pollutants in a specific area....
Read more located at strategic points, which provide representative data from various urban areas. It is managed by the New York State Department of Environmental Conservation (NYSDEC) and the U.S. Environmental Protection Agency (EPA).
The stations are equipped with advanced sensors. They collect data on the presence of major urban pollutants with potential impact on human health, as well as the levels at which they are found:
- Ozone (O3)
- Nitrogen dioxide (NO2)
- Sulphur dioxide (SO2)
- Carbon Monoxide (CO)
- Particulate matter (PM2.5 and PM10)
- Volatile Organic Compounds (VOCs)

Ambient Air Monitoring in New York State – Department of Environmental Conservation
For analysis, the Air Quality Index (AQI) is used as the main reference indicator and rates the concentrations of pollutants on a scale of 0 to 500, with the highest values (from 300) indicating worse air quality.
Legend AQI USEPA
Coloured markers represent the geografical position of the devices. The colour indicates the level of air quality based on the Air Quality Index (AQI)The air we breathe is essential to life. Good air quality makes us feel better and protects our health. The Air Quality Index (AQI) measures the pollutants...
Read more at a given moment indicated by the temporal scroll located at the bottom of the page.
AQI is based on the values of up to six key pollutants (O3, NO2, CO, SO2, PM10, PM2.5) to determine the degree of air pollution at the location of each device. The index corresponds to the poorest level of any of the six pollutants based on the following ranges.
| Pollutant | Index level (based on pollutant concentrations in µg/m3) | |||||
| Good | Moderate | Unhealthy for sensitive groups | Unhealthy | Very unhealthy | Dangerous | |
| (0-50) | (51-100) | (101-150) | (151-200) | (201-300) | (301-500) | |
| PM2.5 (24h) | 0-12 | 12.1-35.4 | 35.5-55.4 | 55.5-150.4 | 150.5-250.4 | 250.5-500.4 |
| PM10 (24h) | 0-54 | 55-154 | 155-254 | 255-354 | 355-424 | 425-604 |
| NO2 (1h) | 0-99.6 | 99.7-188 | 188.1-676.8 | 676.9-1220.1 | 1220.2-2348.1 | 2348.2-3852.1 |
| O3 (8h) | 0-108 | 109-140 | 140-210 | 211-400 | – | – |
| O3 (1h) | – | – | 250-328 | 329-408 | 409-808 | 809-1208 |
| SO2 (1h) | 0-93.13 | 93.14-199.56 | 199.57-494.92 | 494.93-808.91 | – | – |
| SO2 (24h) | – | – | – | – | 808.92-1607.18 | 1607.19-2671.54 |
| CO (8h) | 0-5038 | 5039-10763 | 10764-14198 | 14199-17633 | 17633-34808 | 34809-57708 |
The Air Quality Index is not only an information tool, but also provides essential guidance regarding the protection of public health and improvement in quality of life in New York.
In turn, the teams of scientists generate computer air quality models to predict future air quality scenarios based on present conditions and the variability of meteorological factors such as humidity, wind characteristics and atmospheric pressure.
The generation of these computational models allows us to anticipate the arrival of periods with poor air quality and to take preventive measures.
The data provides daily air quality forecasts that are available to the general public through websites, mobile apps and media distribution.
Likewise, citizens can be notified via a digital platform when incidents of air pollution and bad odours are detected, so that local authorities can take the appropriate measures in time.

Air pollution in New York
Where to find information on New York air quality?
The New York City Air Quality Map is an interactive online tool that provides up-to-date, accessible information on air quality in various areas of the city.
It is a useful tool managed by the New York City Department of Health and Mental Hygiene (NYC DOHMH) and other environmental agencies. The main features of the map are:
- Continuous, real-time monitoring.
- Network of air quality sensorMeasuring air quality is essential for improving human and environmental health. Changes in the natural composition of the air we breathe are common in ind...
Read mores distributed in stations. - Graphical interface where users can interact.
- Colour coded to display information according to the AQI.
- Historical data to see trends and analyse patterns.
- Predictions to forecast future air quality.
- Health advice and warnings, mainly for vulnerable groups such as children and the elderly.
- Easy access for public consultation.
- Promotion of citizen awareness.
In addition, the map can be used in research studies to analyse long-term trends in air quality; it can also assess the effectiveness of environmental policies in place, in order to adapt their measures.
Access to this map via digital platforms allows anyone, from a concerned citizen to an academic researcher, to explore and better understand air pollution patterns in New York.
Ultimately, the air quality map is not only a monitoring tool, but also a catalyst for community action and the continuous improvement of the air New Yorkers breathe every day.

New York traffic
How to improve the air quality in New York?
Although significant progress has been made in improving air quality in New York in recent decades, smog remains a persistent problem, particularly during the summer months.
The combination of vehicle traffic, industrial activity and unfavourable weather conditions contributes towards frequent episodes of poor air quality in the city. To minimise these factors, it is crucial to continue implementing policies and to have technologies with which to protect public health.
Among the main and most effective pollution mitigation measures in New York are:
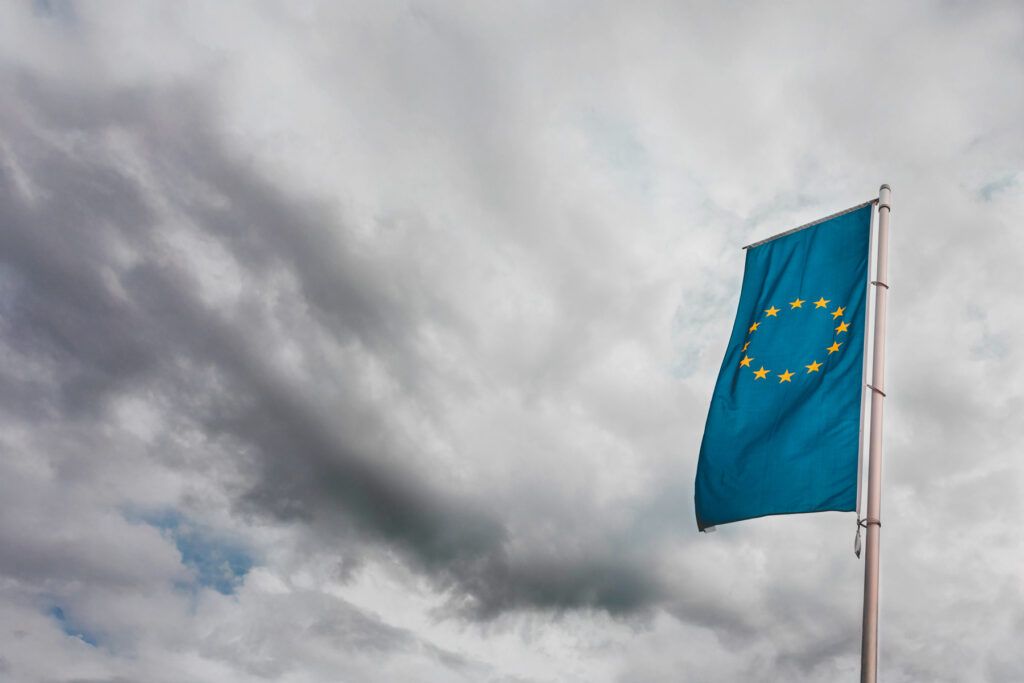
Regulations and policies
New York has implemented strict regulations to control emissions from vehicles and industry. Programmes such as Clean Heat seek to reduce the use of fossil fuels in home heating and cooling systems.
Public transport
Promoting the use of public transport powered by more environmentally friendly energy, bicycles and pedestrian routes helps reduce emissions from combustion engines, while promoting sustainable mobility.
Low-emission zones
Introducing these restricted traffic areas for the most polluting vehicles or low-emission zones (LEZ) is creating a new landscape aimed at improving New York’s air quality.
Need to monitor the air quality in your city?
Download the full report now and find out how Bilbao City Council has reduced air pollution and created a more sustainable city.
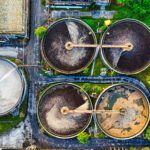
Sustainable waste
Developing sustainable practices in the management of urban waste and wastewater, as well as reducing the incineration of waste.
Monitoring and alerts
Advanced air monitoring systems using autonomous air quality sensors, such as those offered by Kunak, provide reliable, real-time data. They also enable timely decision-making by administrative bodies.
Their data also activate early warnings that notify the population regarding air quality and the measures to take on days of high pollution, so that citizens may avoid staying outdoors longer than advisable.
Clean technologies
Promoting the use of renewable energies and clean technologies in order to reduce industrial emissions and encourage transport using more environmentally friendly vehicles.
Green spaces
Creating more parks and gardens, as well as increasing areas with trees in the city, increases the absorption of atmospheric pollutants and enables a reduction in temperatures, in addition to other changes to the local climate, such as decreased VOC emissions and an increase in the energy efficiency of buildings.
These measures are some of those that are already contributing towards improving the air quality in New York. Only through a holistic vision that engages diverse social sectors and involves New York society as a whole can a positive impact that benefits the air quality of the Big Apple be achieved, even though this would imply the disappearance of the legendary urban fog.
References
American Lung Association. State of the Air 2023 Report. https://www.lung.org/getmedia/338b0c3c-6bf8-480f-9e6e-b93868c6c476/SOTA-2023.pdf
Frederica Perera, Alique Berberian, David Cooley, Elizabeth Shenaut, Hollie Olmstead, Zev Ross, Thomas Matte. Potential health benefits of sustained air quality improvements in New York City: A simulation based on air pollution levels during the COVID-19 shutdown. Environmental Research, Volume 193, 2021, 110555, ISSN 0013-9351, https://doi.org/10.1016/j.envres.2020.110555
Charles L. Blanchard, Stephanie L. Shaw, Eric S. Edgerton, James J. Schwab. Emission influences on air pollutant concentrations in New York State: I. ozone. Atmospheric Environment: X, Volume 3, 2019, 100033, ISSN 2590-1621. https://doi.org/10.1016/j.aeaoa.2019.100033
Sarah Johnson, Jay Haney, Lia Cairone, Christopher Huskey, and Iyad Kheirbek. Assessing Air Quality and Public Health Benefits of New York City’s Climate Action Plans. Environ. Sci. Technol. 2020, 54, 16, 9804–9813, 2020 https://doi.org/10.1021/acs.est.0c00694
Mohammad Tayarani, Amirhossein Baghestani, Mahdieh Allahviranloo, H. Oliver Gao, Spatial/temporal variability in transportation emissions and air quality in NYC cordon pricing.Transportation Research Part D: Transport and Environment, Volume 89, 2020, 102620, ISSN 1361-9209, https://doi.org/10.1016/j.trd.2020.102620
Nowak David J.The Effects of Urban Trees on Air Quality. USDA Services, 2002. http://groundworkdenver.net/devs/Trees_airquality.pdf