Urban traffic emissions monitoring makes it possible to measure pollutants such as NO2, PM2.5, CO, and O3 in real time in order to assess the impact of transportation on air qualityAir quality refers to the state of the air we breathe and its composition in terms of pollutants present in the atmosphere. It is considered good when poll...
Read more. These sensor networks support the management of low-emission zones, the detection of pollution hotspots, and the objective evaluation of sustainable mobility policies in cities.
Urban traffic emissions control has become one of the core pillars of environmental management in cities. As urban areas intensify their sustainable mobility policies, advanced air quality control, through the measurement of the environmental impact of urban transportation, is no longer just a regulatory option. It is becoming an operational necessity.
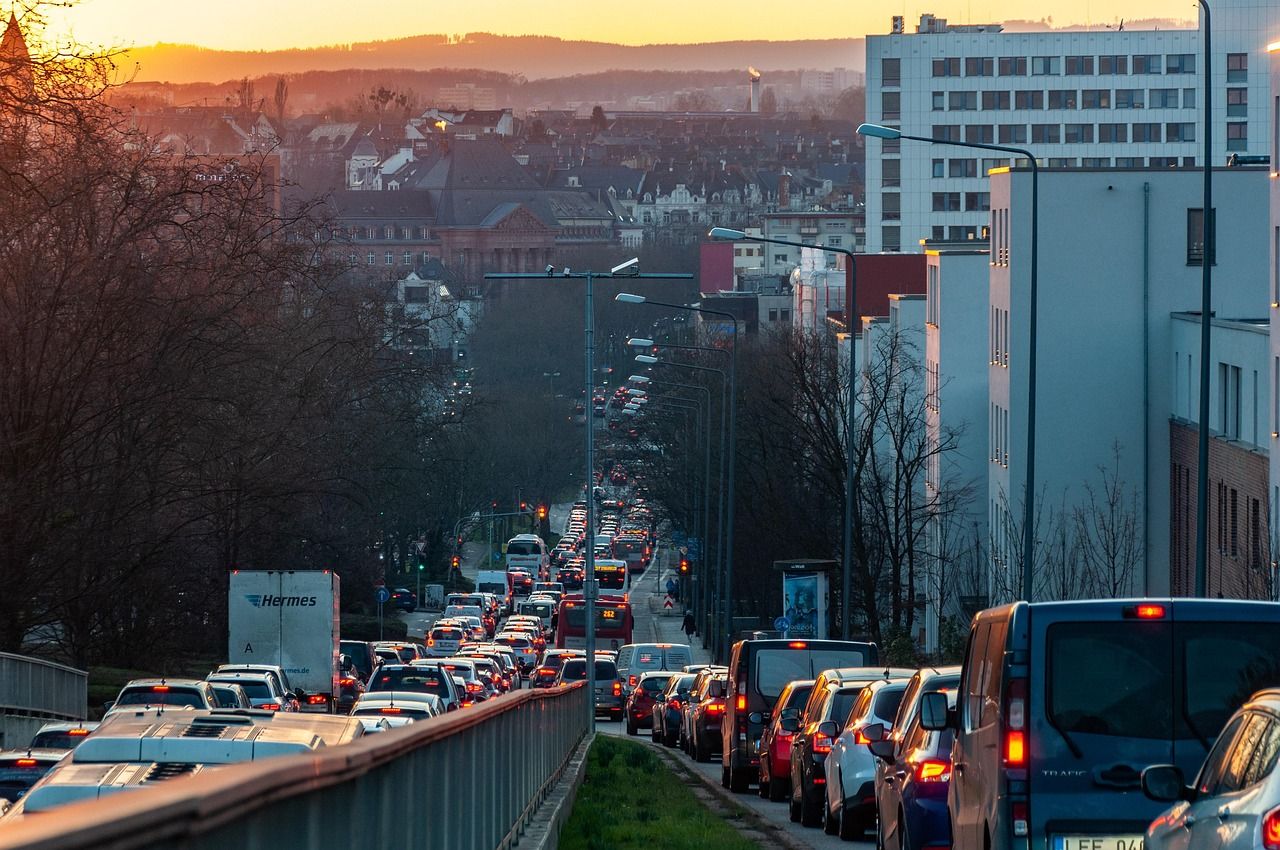
Urban traffic is a nightmare that begins at dawn and ends when the day fades for the millions of people who live in cities. Since the 1960s and 1970s, the private vehicle, elevated to a symbol of freedom and individuality, has shaped an urban development model built around its needs, where its circulation and presence have dominated public space. Living with traffic has become normalized on a global scale, turning the car into a widely accepted social necessity. We live unaware of pollution hotspots, something that is, however, within reach thanks to environmental monitoring for urban mobility. Most citizens live within a short distance of some form of public transportation, yet this does not reduce private vehicle use. We are still far from cities that control urban traffic emissions, and where pedestrian and cycling spaces are the norm rather than the exception.
In response to this structural problem, a more realistic and effective urban management model is moving forward with determination. A model aimed at reducing traffic congestion, measuring the environmental impact of urban transportation and, ultimately, implementing measures to control traffic emissions will help preserve the air quality we breathe.
An urgent transformation for which urban traffic emissions monitoring is absolutely essential. Measuring key pollutants such as NO2, PM2.5, CO, and O3 in real time through air quality sensorMeasuring air quality is essential for improving human and environmental health. Changes in the natural composition of the air we breathe are common in ind...
Read more networks for cities makes it possible to identify critical pollution sources generated by traffic, strengthens the effectiveness of Low-Emission Zones (LEZs), which are increasingly being implemented by regulation in major urban areas, and enables an objective evaluation of the sustainable mobility policies that have been put in place.
Air Quality Innovation in Just 1 Click
Stay informed about the air you breathe!
Subscribe to our newsletter to receive the latest updates on environmental monitoring technology, air quality studies, and more.
Through environmental monitoring for urban mobility, each city seeks solutions to keep traffic under control, optimize its sustainable mobility policies, and improve air quality for its residents. With this article, we want to contribute to that shared goal by examining how this critical source of air pollution is monitored through continuous environmental monitoring, which traffic-related emissions are the most harmful and therefore the highest priority to measure, what evidence existing LEZs are providing, and what challenges any city truly committed to sustainable mobility must face, with viable spaces for the enjoyment and well-being of its residents.

Urban traffic mitigation strategies must reduce demand for private vehicle mobility, optimize traffic flows, and shift trips toward active and public transportation.
Why urban traffic is a critical source of air pollution
Urban road traffic is not just a congestion issue. It is one of the main drivers of air quality degradation in urban environments. According to the European Environment Agency (EEA), road transport accounts for nearly three quarters of air pollutant emissions generated by the transport sector in the EU, directly affecting public health in the most densely populated areas. Unlike other industrial sources, traffic emissions are released at ground level, along the corridors where people are most concentrated, which maximizes public exposure to highly toxic pollutants.
Nearly 80% of deaths related to PM2.5 could be avoided worldwide if current air pollution levels were reduced and aligned with the proposed updated guideline levels. World Health Organization (WHO) 2021.
These figures make urban traffic emissions monitoring a public health tool, not just an environmental one.
NO2 emissions linked to road traffic
Nitrogen dioxide (NO2)Nitrogen dioxide (NO2) is a harmful gas whose presence in the atmosphere is mainly due to the use of fossil fuels in combustion vehicles and industrial act...
Read more is the air pollutant most directly linked to road traffic in urban areas. The EEA identifies road transport as the main source of NO2 in Europe, with the highest concentrations recorded in major cities with heavy traffic volumes, especially at monitoring stations located along high-density traffic routes. Current European legislation sets an annual limit value of 40 µg/m³ for NO2 (Directive 2008/50/EC), a threshold that many European cities still exceed on a recurring basis.
It is especially relevant that the new WHO Air Quality Guidelines (2021) have tightened that reference level to 10 µg/m³ annually, four times lower than the current European legal limit, highlighting the gap between what is legally required and what science considers safe for human health. This gap makes it even more urgent to have sensor networks capable of tracking this pollutant in real time.
Impact of PM2.5 on urban public health
Fine particles (PM2.5) represent one of the most serious health risks associated with urban traffic, precisely because of their ability to penetrate deep into the respiratory system and enter the bloodstream. The WHO, in its Global Air Quality Guidelines (2021), set the annual guideline value for PM2.5 at 5 µg/m³, cutting the previous reference threshold in half in response to the extensive scientific evidence on its cardiovascular, respiratory, and systemic impacts.
One especially relevant fact is that, according to the EEA (2023), the non-exhaust fraction of vehicle-related emissions, that is, emissions from brake, tire, and road surface wear, already accounts for 60% of total PM2.5 emissions from road transport, and this share will continue to grow even with fleet electrification because of the greater weight of electric vehicles. This shows that the energy transition of the urban vehicle fleet, while necessary, will not by itself solve the problem of suspended particles in cities.

Urban transport is responsible for approximately 8% of global CO2 emissions.
What urban traffic emissions monitoring is and how it works
Urban traffic emissions monitoring covers a set of technical, instrumental, and analytical procedures designed to measure, record, and interpret the presence of air pollutantsAir pollution caused by atmospheric contaminants is one of the most critical and complex environmental problems we face today, both because of its global r...
Read more generated by vehicle circulation in cities. Its purpose, beyond quantifying pollution levels, is to generate useful information to guide decisions in sustainable mobility, urban planning, and public health. To do this, it relies on an increasingly broad range of measurement technologies, including high-precision reference stations, low-cost air quality sensor networks for cities, and mobile units installed on vehicles or urban infrastructure.
A key concept in this field is the Data Generating Process (DGP), or the set of factors, sensor type, calibration method, environmental conditions, and data treatment protocol, that determine the quality and reliability of measurements. Understanding how the DGP works is essential for correctly interpreting any urban traffic emissions monitoring data. For example, two sensors may measure the same pollutant in the same location and still produce different results if their data generating processes are not equivalent.
To bring clarity to this field, the European technical specification CEN/TS 17660 proposes a harmonized system for classifying the performance of air quality sensors. This classification distinguishes three levels of measurement quality:
- Class 1 → Indicative measurements, suitable as a complement for regulatory uses.
- Class 2 → Objective estimation, suitable for urban management applications.
- Class 3 → More flexible requirements, intended for non-regulatory uses.
The CEN/TS 17660-1 standard focuses on gas sensors (NO2, O3, CO, SO2, and benzene), while CEN/TS 17660-2:2024 defines the classification procedures for PM10 and PM2.5 particle sensors in ambient air.
Continuous NO2 measurement in urban traffic
Nitrogen dioxide is the reference pollutant for monitoring the impact of road traffic on urban air quality, and its continuous measurement forms the core of any monitoring network focused on sustainable mobility.
For NO2 measurement in urban traffic, reference stations use chemiluminescence analyzers, recognized as the reference method under Directive 2008/50/EC, as they provide minute-level temporal resolution with very low uncertainty. However, their high cost and maintenance requirements make large-scale deployment in urban environments unfeasible.
As a result, low-cost electrochemical sensors (classified under CEN/TS 17660-1) have become the main solution. They operate as nodes within distributed networks and are capable of capturing the spatial variability of NO2 at street level, something traditional networks with few stations cannot achieve. The key to their effectiveness does not rely solely on the individual accuracy of each sensor, but on cross-sensitivity management, calibration, correction of temperature and relative humidity effects, and the statistical integration of data generated across the entire network.

Large transport infrastructures present specific traffic emission monitoring conditions that require differentiated technical approaches.
PM2.5 monitoring in urban environments
Monitoring PM2.5 in urban environments affected by traffic emissions presents specific technical challenges due to the variability in particle composition and size from different emission sources, including exhaust gases, brake wear, tire wear, and road dust resuspension.
These sources generate PM2.5 particles with highly diverse physicochemical characteristics that laser scattering optical sensors, the most commonly used in low-cost air quality networks, do not always accurately differentiate. The CEN/TS 17660-2:2024 specification addresses this limitation by defining testing protocols in aerosol chambers and in field conditions, through co-location with gravimetric reference methods, in order to classify the real performance of each sensor system under variable environmental conditions.
Data integration into real-time pollution maps
The real power of traffic emissions monitoring emerges when individual sensor data are integrated into management platforms capable of generating real-time pollution maps with urban-scale or even street-level spatial resolution.
City air quality sensor networks represent a transformation in monitoring traffic-related pollutants across large urban areas without relying on statistical interpolation, which is typical of conventional monitoring networks.
Data validation has been strengthened through data fusion systems. Real-time data from city air quality sensor networks are integrated with traffic cameras and GPS data, creating a dynamic and actionable view of urban air quality.
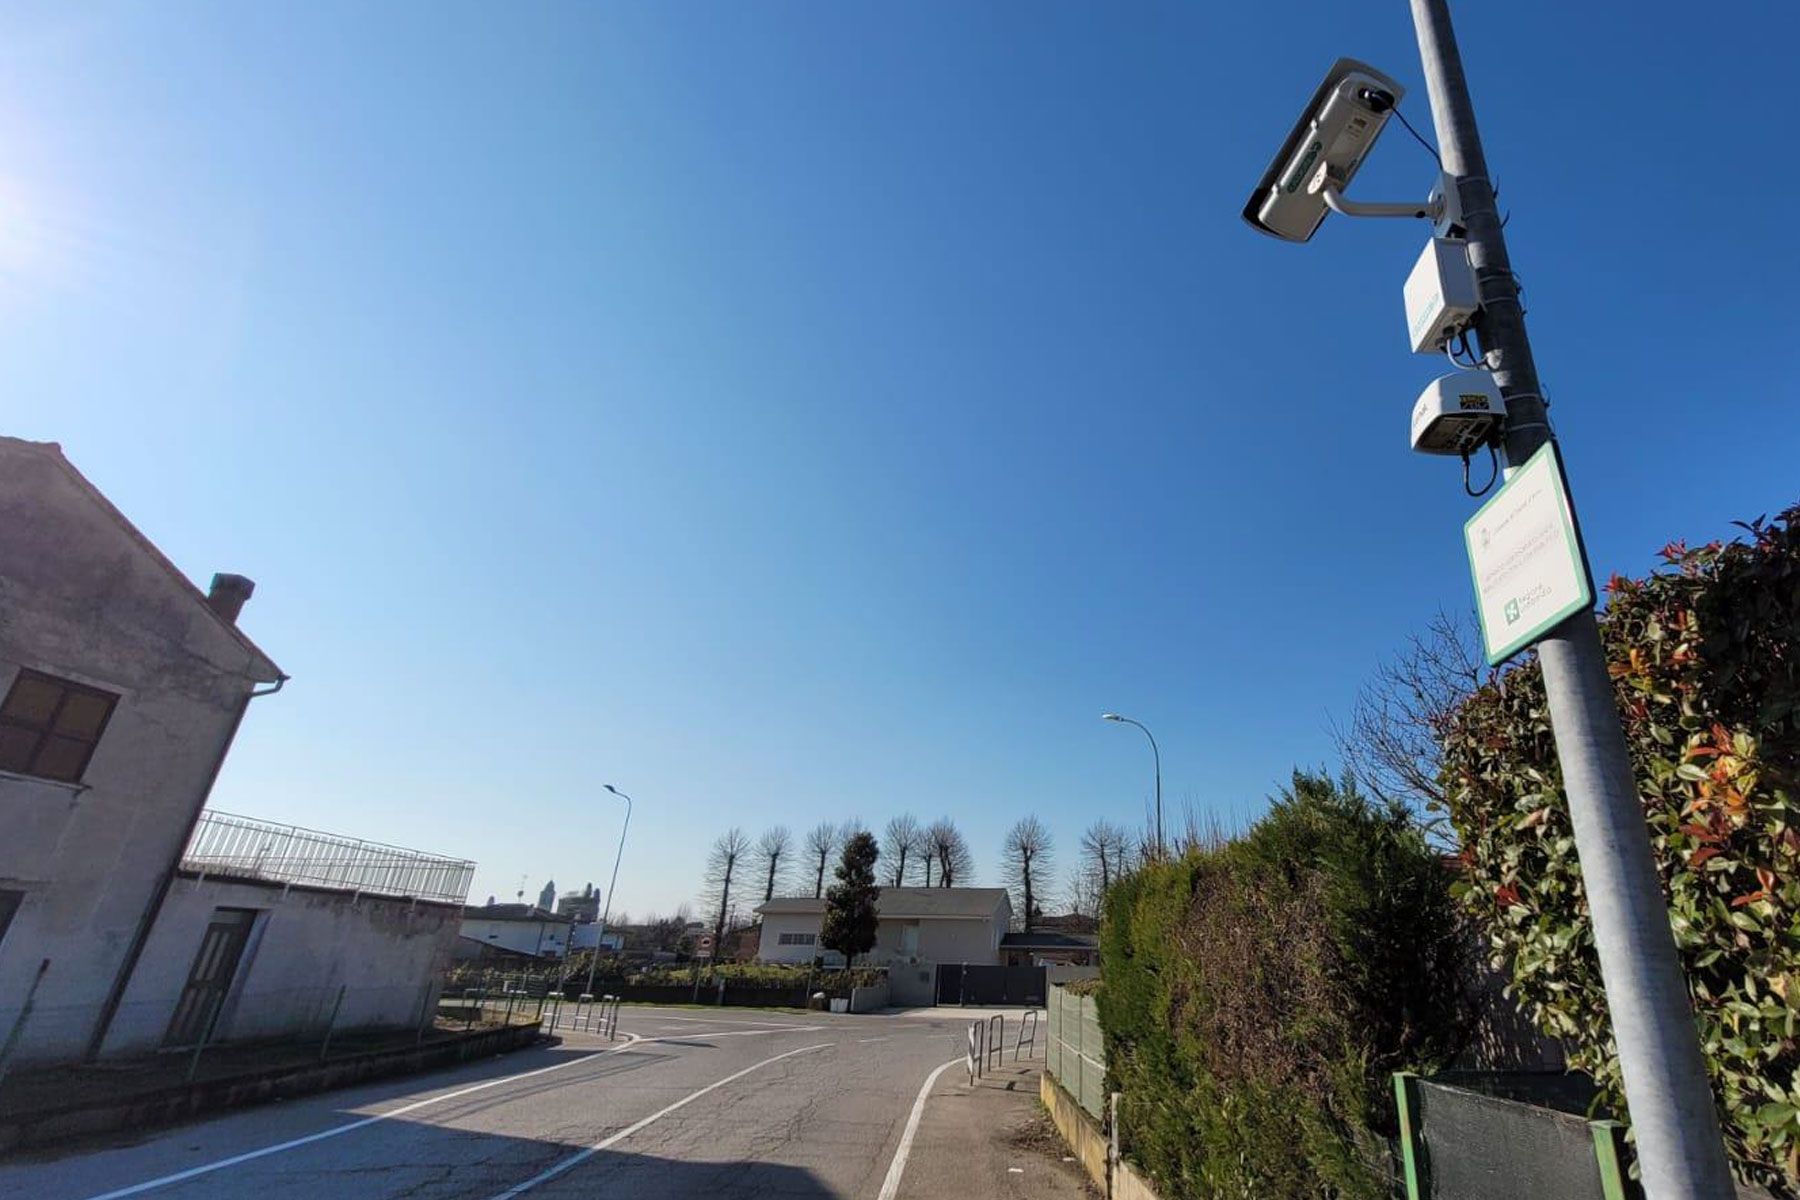
Urban traffic monitoring station in Castel d’Ario, Italy.
Air quality sensor networks for cities
Establishing an urban traffic air quality sensor network goes far beyond deploying a set of measurement devices. It is a knowledge infrastructure for urban mobility that, when properly designed, transforms scattered data into actionable territorial information.
According to the Global Atmosphere Watch (GAW) Programme of the World Meteorological Organization (WMO):
In urban environments, these principles translate into a hybrid network that combines reference stations (equipped with high-precision instrumentation and high acquisition and maintenance costs) with air quality sensor networks (lower cost, higher spatial representativeness, but lower individual accuracy) deployed at density across cities, with performance classification regulated under the European technical specification CEN/TS 17660.
The design of these monitoring networks must be driven by clearly defined measurement objectives before selecting the technology. For example, monitoring compliance with Directive 2008/50/EC requires certified reference methods, while characterizing intra-urban NO2 spatial variability or identifying traffic-related pollution hotspots at street level requires high-density, lower-cost sensor deployments that offer unmatched advantages.
Fixed networks vs. hyperlocal monitoring
Conventional fixed networks, based on reference stations located according to regulatory criteria of zonal representativeness, provide high-quality data with temporal continuity, but their spatial resolution is inherently limited. A single urban station may represent areas between 0.5 and 4 km2, which is insufficient to capture air pollution gradients occurring at street level in high-traffic corridors.
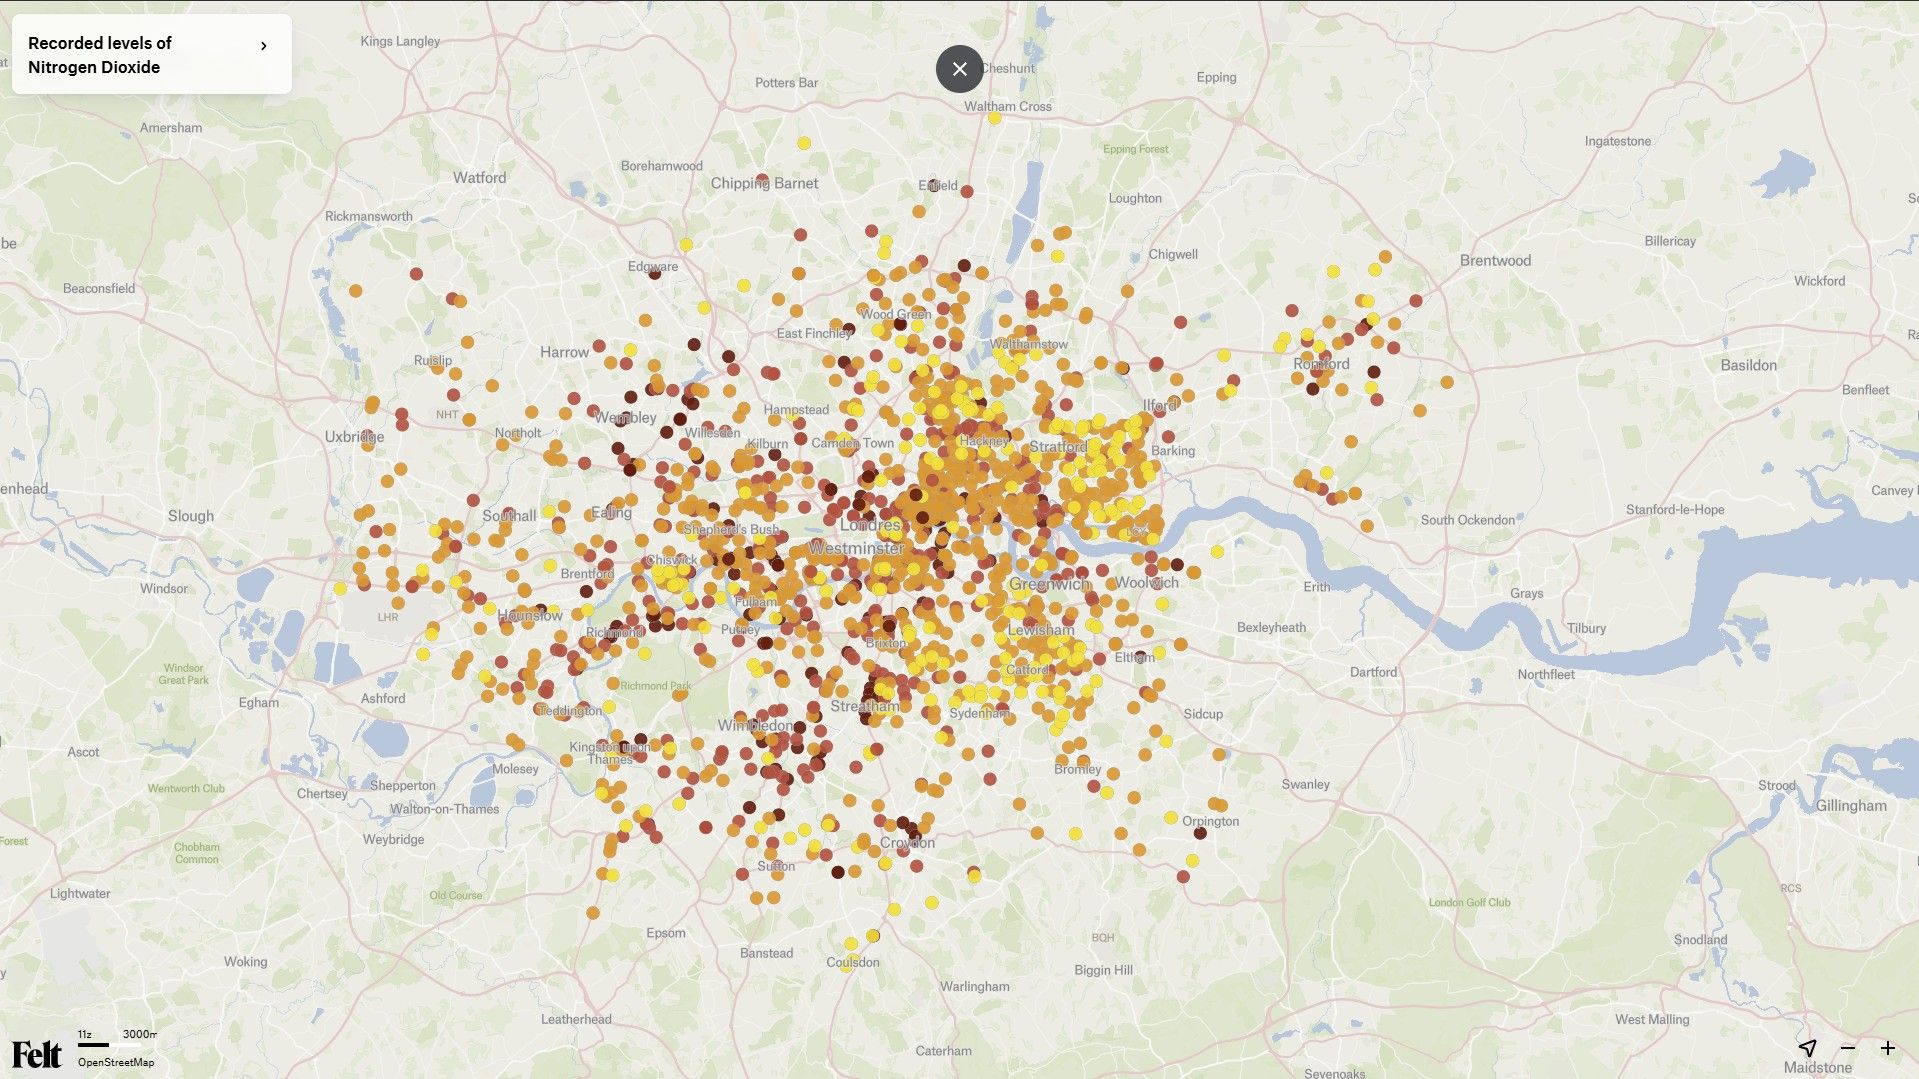
Map of the London air quality sensor network
Hyperlocal monitoring, based on dense networks of low-cost sensors classified under CEN/TS 17660, emerges precisely to fill this spatial resolution gap, deploying dozens or hundreds of nodes along road corridors, critical intersections, school environments, or residential areas near high-traffic roads.
Both urban traffic monitoring approaches are not mutually exclusive but complementary. While reference stations act as calibration and validation anchors for distributed sensors, low-cost sensor networks provide the spatial resolution needed to accurately map real population exposure. This hybrid monitoring model, supported by the Data Generating Process (DGP) framework, enables the combination of heterogeneous data sources without losing traceability and comparability across the entire network.
Detection of pollution hotspots
One of the most tangible values of urban traffic pollution sensor networks is their ability to identify hotspots or critical pollution points. These are locations where pollutant concentrations repeatedly exceed WHO guideline values or legal limits. They are typically associated with high-traffic intersections, bus stops, entrances to underground parking facilities, or road bottlenecks.
The systematic detection of these hotspots requires high temporal resolution (1 to 5 minutes) and sufficient spatial coverage to distinguish between urban background concentrations and highly localized traffic-related exposure peaks.
The most advanced urban traffic monitoring systems integrate data from city air quality sensor networks with real-time traffic flow information, meteorological conditions, and atmospheric dispersion models, making it possible not only to identify existing hotspots but also to anticipate their formation based on expected traffic conditions.
A representative example in Spain of advanced urban traffic monitoring is the Calle 30 Natura project in Madrid, where Kunak AIR Pro stations were deployed along a section of the M-30 to monitor in real time the capture of pollutants (NO, NO2, CO, CO2, and PM) by vertical gardens installed along the road infrastructure.
Beyond the environmental value of the intervention, the project demonstrates a key technical principle: on a high-traffic roadway, only a sensor network positioned at the points of highest exposure can generate the objective evidence required to assess whether an urban measure delivers the expected environmental impact, or merely claims to do so without reliable and traceable data.
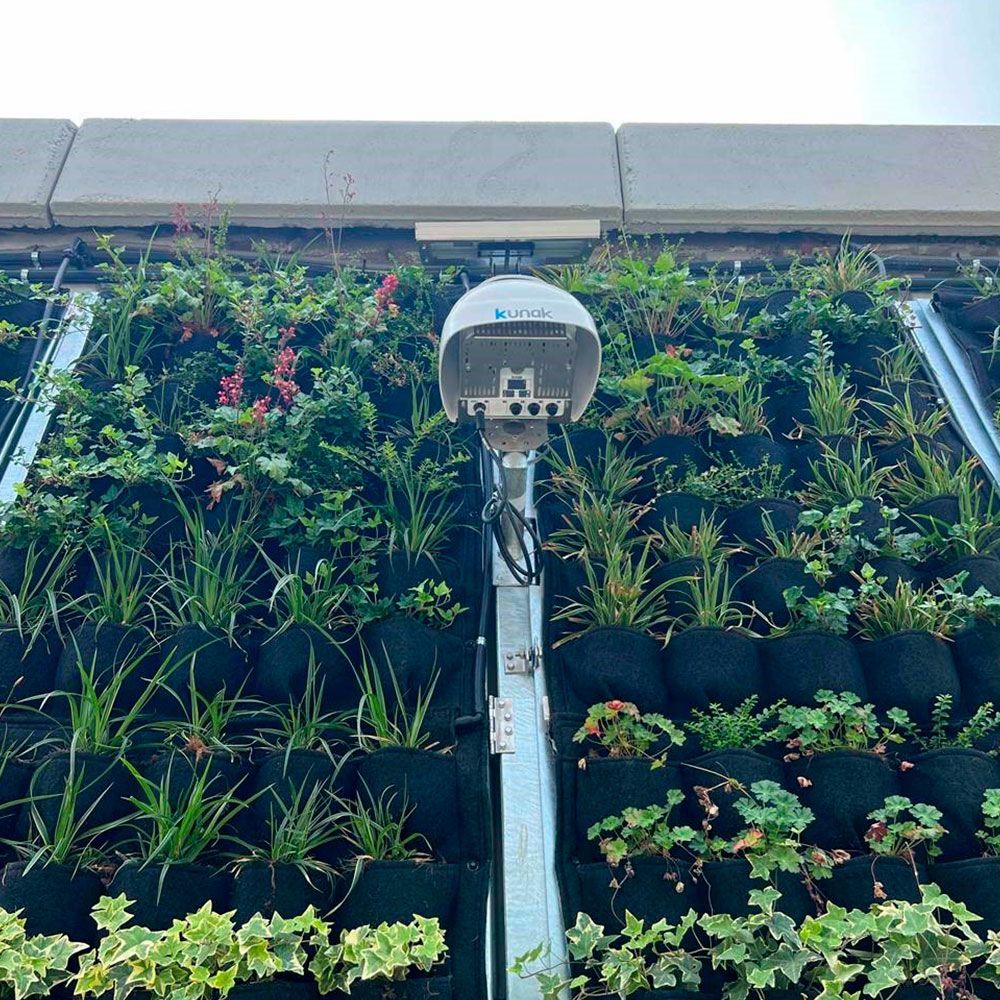
Kunak AIR Pro air quality station installed on one of the vertical gardens in the Calle 30 Natura project in Madrid
Transport infrastructure: roads, tunnels, and railways
Large transport infrastructures present specific traffic emission monitoring conditions that require differentiated technical approaches compared to general urban monitoring.
On high-capacity roads and urban highways, environmental monitoring for urban mobility characterizes the impact of heavy traffic on nearby residential corridors, with particular attention to NO2, PM2.5, ultrafine particlesAt first glance, the air around us may seem clean, but beware, it hides an almost imperceptible danger: ultrafine particles (UFP). With a size so small the...
Read more (UFP), and noiseImagine waking up every morning at 5:00 a.m. to the relentless roar of a motorway just metres from your window. Experiencing such high-intensity noise is n...
Read more pollution, mainly generated by diesel engines and brake and tire wear. Concentrations decrease exponentially with distance from the road but can reach critical levels within the first 150 to 300 meters.

Noise barriers on roads for urban traffic control and management.
Road tunnels are particularly complex and critical environments for urban traffic monitoring. These are areas where forced ventilation, pollutant accumulation in confined spaces, and internal congestion episodes generate concentration peaks of CO, NO2, and PM that must be controlled both for user safety and for the impact of tunnel exits on surrounding urban environments.
In the context of rail transport, air quality monitoringControlling air quality is an essential task in order to enjoy optimal environmental conditions for healthy human development and to keep the environment i...
Read more in underground stations and metro tunnels has revealed PM2.5 and iron particle concentrations from wheel and brake wear that are significantly higher than outdoor levels. This is driving the deployment of dedicated rail traffic pollution sensor networks and the implementation of ventilation and filtration measures across major European metropolitan systems.

Assessing the real impact of transport on air quality in an LEZ requires going beyond simple before-and-after concentration comparisons.
Monitoring in low-emission zones (LEZs)
Low-Emission Zones are currently the most direct urban policy tool to reduce population exposure to pollutants generated by road traffic. In Spain, their implementation became mandatory with the approval of Law 7/2021 of May 20 on climate change and energy transition.
At the European level, Directive 2008/50/EC provides the reference framework for assessing urban traffic air quality, establishing limit values for NO2 (40 µg/m³ annual average) and PM10 (40 µg/m³ annual / 50 µg/m³ daily average) that should be met in the environmental monitoring of LEZs.
Environmental monitoring of low emission zones
A low emission zone without an environmental monitoring system for traffic-related emissions is, in practice, a management measure with no capacity for self-assessment.
Urban traffic not only degrades air quality, it also generates chronic noise pollution whose health effects go far beyond hearing discomfort. Scientific evidence shows that prolonged exposure to road traffic noise triggers sustained release of cortisol, adrenaline and noradrenaline, leading to endothelial dysfunction, vascular inflammation and oxidative stress. Each 10 dB increase in exposure to road traffic noise is associated with a 3.2% increase in overall cardiovascular risk.
In Europe, more than 113 million people are chronically exposed to levels above 55 dB(A), resulting in an estimated loss of 1.3 million healthy life years annually attributable exclusively to transport noise. Münzel, T., Daiber, A., Engelmann, N. et al (2024).
This dual impact (atmospheric and acoustic) reinforces the need for low emission zones to incorporate integrated environmental monitoring systems that go beyond measuring gaseous and particulate pollutants.
Continuous monitoring within and around LEZ perimeters makes it possible to verify whether vehicle access restrictions effectively translate into measurable improvements in air quality and reductions in noise impact, in what magnitude, at what rate, and under which meteorological and traffic conditions.
A representative example of this approach in Spain is the Calle 30 Natura project, promoted by Madrid City Council as part of its Madrid 360 Environmental Sustainability Strategy. The intervention involved the installation of vertical gardens along a 400-metre section of the M-30 (the busiest urban motorway in the Spanish capital) with the aim of improving air quality and adapting infrastructure to climate change, covering 3,250 m2 of concrete surface with durable plant species capable of absorbing pollutants.
To objectively assess pollutant capture by the vegetation and its evolution over time, Kunak AIR Pro monitoring stations were deployed, integrated into foldable panels along the installation, measuring CO, CO2, NO, NO2 and PM in real time.
This case clearly shows the role that independent and continuous measurement must play in any urban intervention that aims to demonstrate (not just claim) its real environmental impact.
Measuring the environmental impact of urban transport
Quantifying the real impact of transport on air quality in a low emission zone requires going beyond simple before-and-after concentration comparisons. The most advanced traffic emission monitoring systems integrate air quality data with traffic counters, fleet classification systems by vehicle type and emission level, and meteorological sensors, building correlation models that allow the specific contribution of road traffic to be separated from other urban pollution sources (heating, industrial activity or background pollution).
This source differentiation is particularly relevant to assess the real effect of partial fleet electrification. While the transition to electric vehicles significantly reduces tailpipe emissions of NO2 and CO, PM2.5 emissions from brake, tyre and road wear already account for 60% of total road transport particles according to the EEA (2023), and remain largely unchanged, which continuous traffic monitoring can detect and quantify with precision.
Directive 2008/50/EC also requires Member States to develop air quality plans when limit values are exceeded. For this purpose, data from LEZ monitoring networks provides the objective evidence on which both the diagnosis and the evaluation of corrective measures must be based.
Objective evaluation of traffic restrictions
A rigorous evaluation of traffic restrictions implemented in a low emission zone requires a measurement protocol structured in three phases:
- Baseline assessment: establishes air quality and traffic flow conditions before restrictions are introduced.
- Implementation monitoring: detects the immediate response of pollutants to changes in fleet composition.
- Long-term evaluation: analyses medium- and long-term trends to distinguish structural improvements from context-driven variations.
A critical aspect of this evaluation of sustainable mobility policies is controlling the so-called displacement effect. It is on the outer perimeter roads where access restrictions in the LEZ core can lead to traffic increases and therefore higher pollutant concentrations. This is a phenomenon that only a traffic air quality monitoring network with sufficient spatial coverage beyond the restricted perimeter can detect and quantify.
For this reason, Spanish Law 7/2021 establishes that sustainable urban mobility plans linked to LEZs must include periodic monitoring and evaluation indicators. Continuous environmental monitoring in LEZs provides the objective and independent data base required to ensure accountability to both citizens and authorities.

A rigorous evaluation of traffic restrictions implemented in a low emission zone requires a structured measurement protocol.
Urban traffic emission control
Urban traffic emission control has evolved from a reactive approach to a proactive position where real-time environmental data directly feeds into the management and evaluation of sustainable mobility policies.
Urban transport is responsible for approximately 8% of global CO2 emissions, generating around 3 GtCO2 annually. The most effective mitigation strategies are not limited to technology (fleet electrification) but must focus on reducing private vehicle demand, optimising traffic flows and shifting trips towards active and public transport.
However, in the most ambitious mitigation scenarios, global transport emissions could be reduced by 68% by 2050 compared to 2010 levels, while they would increase by 65% without the application of environmental monitoring measures in urban mobility. This gap between scenarios turns the control and management of urban traffic emissions, based on air quality data, into a climate policy instrument, not just an environmental one.
Real-time pollution maps for municipal management
Real-time pollution maps are the interface between urban traffic air quality monitoring and decision-making for managing sustainable urban mobility.
They integrate data streams from city air quality sensor networks, reference stations, meteorological information, and atmospheric dispersion models to provide municipal managers with a dynamic territorial view of air quality at street level, continuously updated.
Their practical value goes beyond visualization. When predefined thresholds for NO2, PM2.5, or O3 are exceeded, these systems can automatically trigger real-time countermeasures (traffic diversions, LEZ restrictions, public alerts) without requiring direct human intervention.
Traffic signal optimization and flow management
Smart regulation of traffic signal cycles is one of the most effective ways to reduce emissions, offering immediate returns with minimal infrastructure investment.
The mechanism is straightforward. Congestion and repeated stops at traffic lights generate acceleration and braking cycles that significantly increase NOx, CO, and PM emissions compared to smooth traffic flow. Reducing these effects through adaptive traffic signal control (ATSC) improves both mobility and air quality.
A study published in Nature Communications (2025), based on simulations across the 100 most congested cities in China, found that
The implementation of adaptive traffic signals powered by big data could reduce urban traffic CO2 emissions by 6.65% at the city scale (equivalent to 31.73 Mt of CO2 annually), while increasing average speeds by 17% and reducing travel times by 7 minutes per trip. Wu, K., Ding, J., Lin, J. et al. (2025).
Beyond CO2 emissions, the significant reductions achieved in NOx, NH3, and VOCs, precursors of PM2.5 and O3, make traffic signal optimization a priority public health measure.
The installation of traffic signals in Denver (Colorado, USA), with real-time communication and decision-making based on city air quality sensors, lays the foundation for greater smart city integration. These systems become valuable data points for citywide initiatives aimed at monitoring urban air quality, reducing energy consumption, and even prioritizing routing for emergency vehicles.
For the most advanced and densely populated cities, these urban air quality monitoring systems also serve as a high-value public communication tool. Making real-time pollution data accessible strengthens the social legitimacy of restrictive measures and supports continuous evaluation of their effectiveness.
Operational cost reduction and data-driven planning
Continuous urban traffic emissions monitoring is not only a regulatory compliance tool, it also functions as an economic efficiency tool for local governments.
Data-driven planning replaces periodic inspection and diagnostic cycles, which are costly, infrequent, and spatially limited, with continuous monitoring systems that generate actionable information at all times, reducing the costs associated with reactive pollution management.
At the urban scale, access to historical and real-time data on air quality and traffic flows:
- Optimizes the placement of new transport infrastructure and the design of low-impact routes for urban freight transport.
- Refines the spatial and temporal scope of LEZs based on empirical criteria.
- Evaluates the environmental and public health return of each investment in sustainable mobility measures.
Investments in active and public transport infrastructure, combined with intelligent traffic management systems, represent highly viable and cost-effective strategies compared to other urban traffic mitigation options, with direct benefits for public health, social cohesion, and urban space quality. IPCC, Sixth Assessment Report (AR6).

Each 10 dB increase in exposure to road traffic noise is associated with a 3.2% increase in overall cardiovascular risk.
Evidence-based sustainable mobility
The EU Urban Mobility Framework (European Commission, 2021) established this principle as a cornerstone of European transport policy through the Sustainable Urban Mobility Plans (SUMP), a strategic framework designed to meet the mobility needs of people and businesses in cities and their surroundings, with the goal of improving quality of life.
Within this framework, all urban nodes of the TEN-T network (Trans-European Transport Network, a strategic initiative to develop a modern, interconnected multimodal infrastructure network across Europe) must now incorporate, for the first time on a mandatory basis, systematic monitoring and evaluation indicators of environmental progress, recognizing that sustainable mobility must be measured in order to be effectively managed.
In Latin America, CAF (Development Bank of Latin America and the Caribbean) has committed a historic investment of $18 billion through 2035 to transform the transport sector in the region, with a strong focus on fleet electrification, active mobility, and low-carbon integrated planning.
More than 80% of the Latin American population lives in urban areas and depends on often inefficient transport systems to access employment, education, and essential services.
Key environmental indicators
A sustainable urban traffic mobility strategy must be based on accurate evidence supported by a well-defined system of environmental indicators that are measurable and comparable over time.
In the European context, the EU Urban Mobility Framework has developed the SUMI (Sustainable Urban Mobility Indicators) index, which includes dimensions such as air quality, CO2 emissions, population exposure to pollutants, road safety, and accessibility.
For traffic emissions monitoring, the key environmental indicators include:
- Annual average NO2 concentration in traffic corridors and within LEZs, assessed against the legal limit of 40 µg/m³ (Directive 2008/50/EC) and the WHO guideline value of 10 µg/m³.
- Annual average PM2.5 concentration, compared with the European limit of 25 µg/m³ and the WHO threshold of 5 µg/m³.
- Number of exceedance days of daily PM10 limit values (50 µg/m³) and ozone (O3) information and alert thresholds.
- Indoor/outdoor pollution gradient within LEZs, measuring the effective difference in air quality between restricted areas and their perimeter.
- Temporal evolution of the circulating vehicle fleet composition by propulsion type and emission label, correlated with observed air quality variations.
These indicators must be available in open, up-to-date, and publicly accessible formats to become a strategic component of sustainable mobility policy, enabling comparability between cities, regional analysis, and public accountability.

Sustainable urban traffic mobility requires control at critical points such as urban tunnels.
Before-and-after comparison of LEZ implementation
Assessing the real impact of an LEZ on air quality requires a rigorous methodological design that controls for the influence of external factors such as meteorological variability, seasonality, changes in the vehicle fleet, or transboundary pollution episodes.
The effectiveness of urban traffic measures depends on three key factors: the rigor of the initial technical design, the actual scope of restrictions adapted to the local fleet composition, and the availability of sufficiently dense monitoring data to isolate the effect attributable to the LEZ from statistical noise caused by other variables.
Data transparency and public trust
The social legitimacy of urban traffic restriction measures largely depends on the credibility of the environmental data that supports them. When citizens can access real-time air quality information in their neighborhood, compare it with international reference standards, and verify how indicators evolve before and after restrictions, the acceptance of LEZs and other sustainable mobility measures increases significantly.
For local administrations, having verifiable and publicly accessible monitoring data also serves as institutional protection against opposition from affected sectors. Objective air quality data, with historical records, documented methodologies, and regulatory references, becomes the strongest argument to justify the proportionality and necessity of each implemented measure.
Urban traffic emissions are projected to reduce global transport emissions by 68% by 2050 compared to 2010 levels.
Technical challenges of urban environmental monitoring
The expansion of air quality sensor networks in urban environments has democratized access to environmental data at an unprecedented scale, but it has shifted the challenge from data scarcity to a more complex issue: ensuring that these data are reliable, comparable, and technically traceable.
Low-cost sensors offer clear advantages in terms of cost, size, and ease of deployment, but their performance under real-world conditions is affected by factors such as sensor drift, cross-interference between pollutants, and sensitivity to environmental conditions (temperature, relative humidity, pressure), which can significantly alter readings if not properly controlled and corrected. These challenges do not invalidate the usefulness of sensors, but they require a rigorous technical approach to ensure that the data generated are scientifically defensible and relevant for regulatory use.
Data classification and traceability
Data traceability, the documented information linking each measurement to national and international reference standards, is the primary requirement for any air quality data intended for regulatory use or public policy related to urban traffic.
Historically, standardized reference methods under Directive 2008/50/EC were the only ones providing this guarantee. However, low-cost sensors lacked an equivalent evaluation framework.
The European technical specification CEN/TS 17660 partially addressed this gap by establishing a structured and harmonized protocol to assess sensor system performance under defined measurement conditions, ensuring that test results are consistent and transparent. Its three-class classification system links each performance level to the data quality objectives (DQO) defined in Directive 2008/50/EC, allowing users to clearly understand what regulatory or management use is appropriate for each type of classified sensor.
However, the specification itself, particularly CEN/TS 17660-2, notes that classification test results do not guarantee performance outside test conditions or over time. This makes it essential to establish continuous quality control and maintenance regimes in real deployments. In this context, the concept of the Data Generating Process (DGP) allows the full set of conditions under which data are produced to be characterized. This becomes critical because without documenting the DGP, data traceability is incomplete and interpretation may be flawed.
Difference between modeling and independent measurement
One of the most relevant technical debates in urban traffic air quality monitoring is the distinction between independent measurement and modeled data, two categories that are often presented indistinguishably in air quality visualization platforms, leading to misinterpretation by both municipal managers and the public.
An independent measurement is the direct result of a physical sensor exposed to ambient air, with its documented uncertainty and traceable calibration process. A modeled data point is a calculated estimate derived from the combination of multiple data sources such as emission inventories, meteorological conditions, satellite data, or remote sensor readings, processed through atmospheric dispersion models.
Both approaches are valuable and have legitimate uses, but they are not interchangeable. While models are powerful tools for prediction and spatial planning, they cannot replace direct measurement when it comes to verifying regulatory compliance, assessing real population exposure, or demonstrating the effectiveness of an LEZ.
Quality assurance in dense networks
The deployment of dense urban traffic air quality monitoring networksAir quality monitoring networks consist of an organised system of monitoring stations distributed across various locations to measure and assess air pollut...
Read more using sensors multiplies quality assurance challenges, particularly in maintaining consistency and comparability across dozens or hundreds of nodes operating under diverse environmental conditions. Achieving this requires systematic QA/QC (Quality Assurance / Quality Control) protocols adapted to network scale.
In practice, advanced sensor systems structure their quality assurance strategy around two complementary calibration procedures (calibration being the adjustment of sensor response based on reference concentration values, enabling the exact measurement uncertainty to be determined) and a set of correction mechanisms operating continuously between calibrations:
- Co-location calibration with a reference station (A1): the sensor is calibrated against data from reference instruments at the same measurement point. This is the most established practice for gas cartridges, requiring only two points, baseline and span, and for particle sensors, where a calibration factor is derived from reference data. It ensures regulatory traceability and is recommended every six months and at key milestones in the sensor lifecycle.
- Calibration using certified gas cylinders (A2): performed by connecting a certified gas cylinder compliant with ISO 6141 and traceable to NIST standards directly to the sensor station using a gas hood, following a protocol equivalent to that used with reference instruments. Like co-location, it requires only two calibration points, baseline and span, and allows independent determination of measurement uncertainty without requiring access to a field reference station. This approach is particularly valuable in dense networks deployed in hard-to-access locations or areas far from reference stations, providing equivalent traceability autonomously.
Between calibrations, long-term drift in gas cartridges is managed through Automatic Drift Correction (ADC), which combines continuous baseline correction (ABC) using deterministic statistical methods applied to sensor history, with compensation for long-term sensitivity changes (ASC). For particulate matter sensors, continuous correction relies on MCERTS factors, obtained during sensor certification testing and applied at the factory level.
This structured framework of calibration, correction, and verification, executed according to a Standard Operating Procedure (SOP) schedule that includes continuous remote monitoring, cartridge replacement, and periodic inspections every six, twelve, and twenty-four months, ensures that the data generated by a dense sensor network maintain their traceability, comparability, and usefulness throughout their operational lifecycle.
The most advanced frontier in this field is the development of trust-based dynamic calibration systems, which automatically adjust the complexity of correction models based on the real-time assessed reliability of each sensor, reducing dependence on manual interventions and significantly improving overall network accuracy.
The US EPA recommends that any sensor network deployment include from the design stage a documented Quality Assurance Project Plan (QAPP), specifying calibration procedures, data acceptance and rejection criteria, maintenance protocols, and drift alert thresholds, as a prerequisite for ensuring that the generated data are defensible before regulatory authorities.

Outer perimeter roads where access restrictions in the core of an LEZ may lead to increased traffic and, consequently, higher pollutant concentrations.
Frequently asked questions about urban traffic emissions monitoring
Why is it important to measure NO2 in urban traffic?
Nitrogen dioxide (NO2) is a pollutant generated by internal combustion engines, especially diesel engines. It is formed through the oxidation of atmospheric nitrogen at high temperatures and acts as a direct indicator of urban traffic activity. Its presence in city air accurately reflects traffic intensity and fleet composition.
NO2 is a gas that irritates the respiratory tract and also damages the cardiovascular system. The most vulnerable groups are children, older adults, and people with pre-existing conditions, who often live near high-traffic roads.
The temporal and spatial variations of NO2 at the urban level indicate changes in vehicle flow, shifts in fleet composition, and the effectiveness of management measures such as restrictions, urban tolls, or Low-Emission Zones.
When evaluating an LEZ, the reduction of NO2 within the perimeter, compared with external stations, is the fastest and most sensitive signal for determining whether the measure is working.
Which pollutants should be measured in an LEZ?
The set of pollutants that should be monitored in a Low-Emission Zone is determined by Directive 2008/50/EC and by the specific objectives of each zone. In technical practice, it is advisable to go beyond the legal framework and prioritize monitoring of:
- NO2: nitrogen dioxide is the direct indicator of vehicle activity and the main regulatory reference pollutant for assessing traffic impact.
- PM2.5: fine particles are the pollutant with the greatest impact on cardiovascular and respiratory health, and in traffic environments they originate from both exhaust emissions and the wear of brakes, tires, and road surfaces.
- PM10: coarse particles are especially relevant due to road dust resuspension and infrastructure wear.
- O3: tropospheric ozone is a secondary pollutant formed from NOx and VOCs in the presence of solar radiation, with especially relevant concentration peaks during the summer months.
In LEZs with significant heavy traffic or located near industrial sources, it is also advisable to include CO and benzene monitoring as additional tracers of incomplete combustion. In underground parking facilities and tunnels, CO becomes a priority because of immediate safety concerns.
The final selection of pollutants to monitor in urban traffic must follow a basic principle: measure what makes it possible to objectively assess whether the LEZ is fulfilling its purpose of improving air quality and reducing population exposure to the pollutants most harmful to health.
How do real-time pollution maps help municipalities?
Real-time pollution maps transform raw data collected by urban traffic air quality sensor networks into actionable and accessible territorial information for both municipal technicians and the public. They turn environmental monitoring into a smart urban management tool. They measure the problem and, at the same time, actively guide its solution. Their value for municipalities operates on three levels:
- Operational: they detect threshold exceedances immediately, identify pollution hotspots at street-level resolution, and trigger automatic countermeasures such as traffic diversions, public alerts, or dynamic LEZ restrictions, without waiting for periodic reports from conventional reference stations.
- Strategic: the accumulation of georeferenced historical data makes it possible to identify recurring pollution patterns, correlate concentration peaks with traffic flows, meteorological conditions, or specific events, and plan with proven criteria the location of new infrastructure, sustainable mobility lanes, or LEZ expansions.
- Transparency and governance: making real-time air quality data public strengthens trust in sustainable mobility policies. When citizens can independently verify whether air quality in their neighborhood improves, or does not improve, after a restrictive measure is introduced, the social legitimacy of that measure is built on objective evidence rather than on a simple statement.
What is the difference between reference stations and sensor networks?
Reference stations use high-precision analytical instrumentation, such as chemiluminescence analyzers for NO2 and gravimetric methods for PM, validated under Directive 2008/50/EC as official reference methods. They provide data with very low uncertainty and full traceability, but their installation and maintenance costs limit deployment to only a few points per city, which greatly reduces spatial resolution and, therefore, representativeness.
Low-cost sensor networks, classified under CEN/TS 17660, give up part of that individual precision in exchange for territorial density. With dozens or hundreds of nodes distributed at street level, they produce a spatial picture of pollution that reference stations, because of their scarcity, cannot provide.
The key difference is not one of technical superiority, but of complementary function. While reference stations ensure regulatory traceability of the data, sensor networks provide the spatial resolution needed to manage air quality at the real urban scale. A robust monitoring system needs both layers, with reference stations serving for calibration and validation, and low-cost urban traffic sensor networks serving as the infrastructure for continuous territorial knowledge.
How is the real impact of a sustainable mobility policy evaluated?
Evaluating the real impact of a sustainable mobility policy, whether an LEZ, bike lane, access restriction, or new public transport line, requires a measurement protocol structured in three phases that no estimation model can replace.
- Baseline diagnosis: to establish a solid starting point for air quality, traffic flows, and fleet composition before the measure comes into force. Without this reference point, any later variation lacks a valid benchmark for comparison.
- Monitoring during implementation: to track how pollutants respond to the introduced changes, while simultaneously controlling meteorological and traffic variables that may hide or exaggerate the actual effect of the policy.
- Longitudinal evaluation: to analyze medium and long-term trends and distinguish structural improvements attributable to the measure from temporary variations linked to external factors such as seasonal episodes or changes in economic activity.
A critical element throughout this sustainable mobility process is to extend monitoring beyond the perimeter of the intervened area in order to detect possible traffic displacement effects toward surrounding roads. A policy that improves air quality inside the zone at the cost of worsening it immediately outside does not represent a net gain for public health.

Urban traffic emissions control has evolved from a reactive approach to a proactive one.
Conclusion: towards intelligent and transparent management of transport emissions
Scientific evidence leaves no room for doubt. Pollution generated by urban traffic is a public health emergency that unfolds silently but is fully measurable. Urban traffic emissions monitoring has emerged as the knowledge infrastructure that enables intelligent and adaptive management, forming the foundation of effective urban mobility. Without robust and continuous air quality data that are territorially representative, Low-Emission Zones become administrative boundaries without the ability to self-evaluate; sustainable mobility plans turn into statements of intent without evidence of impact; and traffic restrictions become measures open to challenge by both citizens and courts.
However, with urban traffic monitoring networks, cities gain the foundation needed to design effective policies, adjust their scope based on results, and report transparently on real progress in protecting public health.
Beyond regulatory compliance, the strategic value of urban traffic air quality monitoring is even greater. Local administrations that integrate low-cost air quality sensor networks into their urban management systems not only improve public health, but also build the data infrastructure needed to optimize traffic in real time, reduce operational costs, plan modal transitions effectively, and demonstrate commitment to a development pathway aligned with climate goals.
The cities leading the transition toward truly sustainable mobility are those capable of accurately measuring their starting point, managing intelligently the path toward a more livable urban environment, and demonstrating with data the impact of every decision. Ultimately, evidence-based urban management means not compromising on rigor when the data are uncomfortable, and not giving up ambition for cleaner air when the data confirm that urban transformation is possible.
References
- Snyder, E. G., Watkins, T. H., Solomon, P. A., Thoma, E. D., Williams, R. W., Hagler, G. S. W., Shelow, D., Hindin, D. A., Kilaru, V. J., & Preuss, P. W. (2013). The Changing Paradigm of Air Pollution Monitoring. Environmental Science & Technology, 47(20), 11369–11377. https://doi.org/10.1021/es4022602
- Münzel, T., Daiber, A., Engelmann, N. et al. Noise causes cardiovascular disease: it’s time to act. J Expo Sci Environ Epidemiol 35, 24–33 (2025). https://doi.org/10.1038/s41370-024-00732-4
- Gao Y. Ou X-M. (2022). Interpretation of IPCC AR6 report: transportation carbon emissions reduction pathways strengthening technology and management innovation. Climate Change Research 2022, Vol. 18 Issue (5): 567-573. https://www.climatechange.cn/EN/10.12006/j.issn.1673-1719.2022.149
- Wu, K., Ding, J., Lin, J. et al. (2025). Big-data empowered traffic signal control could reduce urban carbon emission. Nat Commun 16, 2013 (2025). https://doi.org/10.1038/s41467-025-56701-4
- Dong, J., Goodman, N., Carre, A. and Rajagopalan, P. (2025) Calibration and validation-based assessment of low-cost air quality sensors. Science of The Total Environment, Volume 977, 2025, 179364. https://doi.org/10.1016/j.scitotenv.2025.179364