Kunak AIR Cloud
Air quality software
Simplify data analysis and get actionable insights for decision-making
REAL-TIME DATA | ALWAYS UPDATED

Product
information

Air quality monitoring software
Visualise and analyse the data collected by your sensor network.
Kunak AIR Cloud is an easy-to-use data analysis software for decision-making. Access real-time data collected by the sensor network to make decisions that help improve air quality in the environment and protect people’s health.
The Kunak AIR Cloud web platform offers professionals a complete suite for air quality data analysis, as well as a new way to remotely operate the network, manage devices, set alarms, calibrate and perform field operations.
Choose the tools you need for your project.
Kunak AIR Cloud is a modular and flexible software designed to facilitate user account management, easy network operation, intuitive data analysis and validation, and fast and intuitive reporting.
Features:

Cloud based

Reliable data guaranteed

Flexible & scalable

Multiple users

Data integration

Advanced tools
Air pollution software
Analyse and understand pollution behaviour.
Thanks to the air quality software, you will:
Our air quality monitoring software is the perfect complement to unleash the full potential of Kunak AIR stations and air pollution monitoring networks.
Benefits

Secure & Confidential
HTTPS/SSL protocols. Confidentiality and ownership of data are guaranteed by EULA.

Free continuous updates
Always be up-to-date. Enjoy any new tool or functionality immediately without additional cost.

Air quality reports
Create custom reports to show AQ data in required formats to share with your clients or external agencies.

Automatic supervision
Monitor the health of your stations & sensors remotely and troubleshoot with automatic tips.
Reliable data guaranteed
Ensure reliable data thanks to automatic data invalidation. Benefit from advanced algorithms for automatic data tagging.

Pollution sources & hotspots identification
Powerful air quality tools and advanced data visualization over the map.

Remote troubleshooting
Service, diagnose and troubleshoot your stations remotely. Get remote support from our team.

Easy data sharing & integration
Share the collected data via API or export in different formats. Insert data from 3rd party devices.

Public air quality data
Create public web portals and widgets to share air quality data with stakeholders.
Tools
Control panel
Check the status of your devices and easily view reliable data in real-time thanks to automatic data tagging.

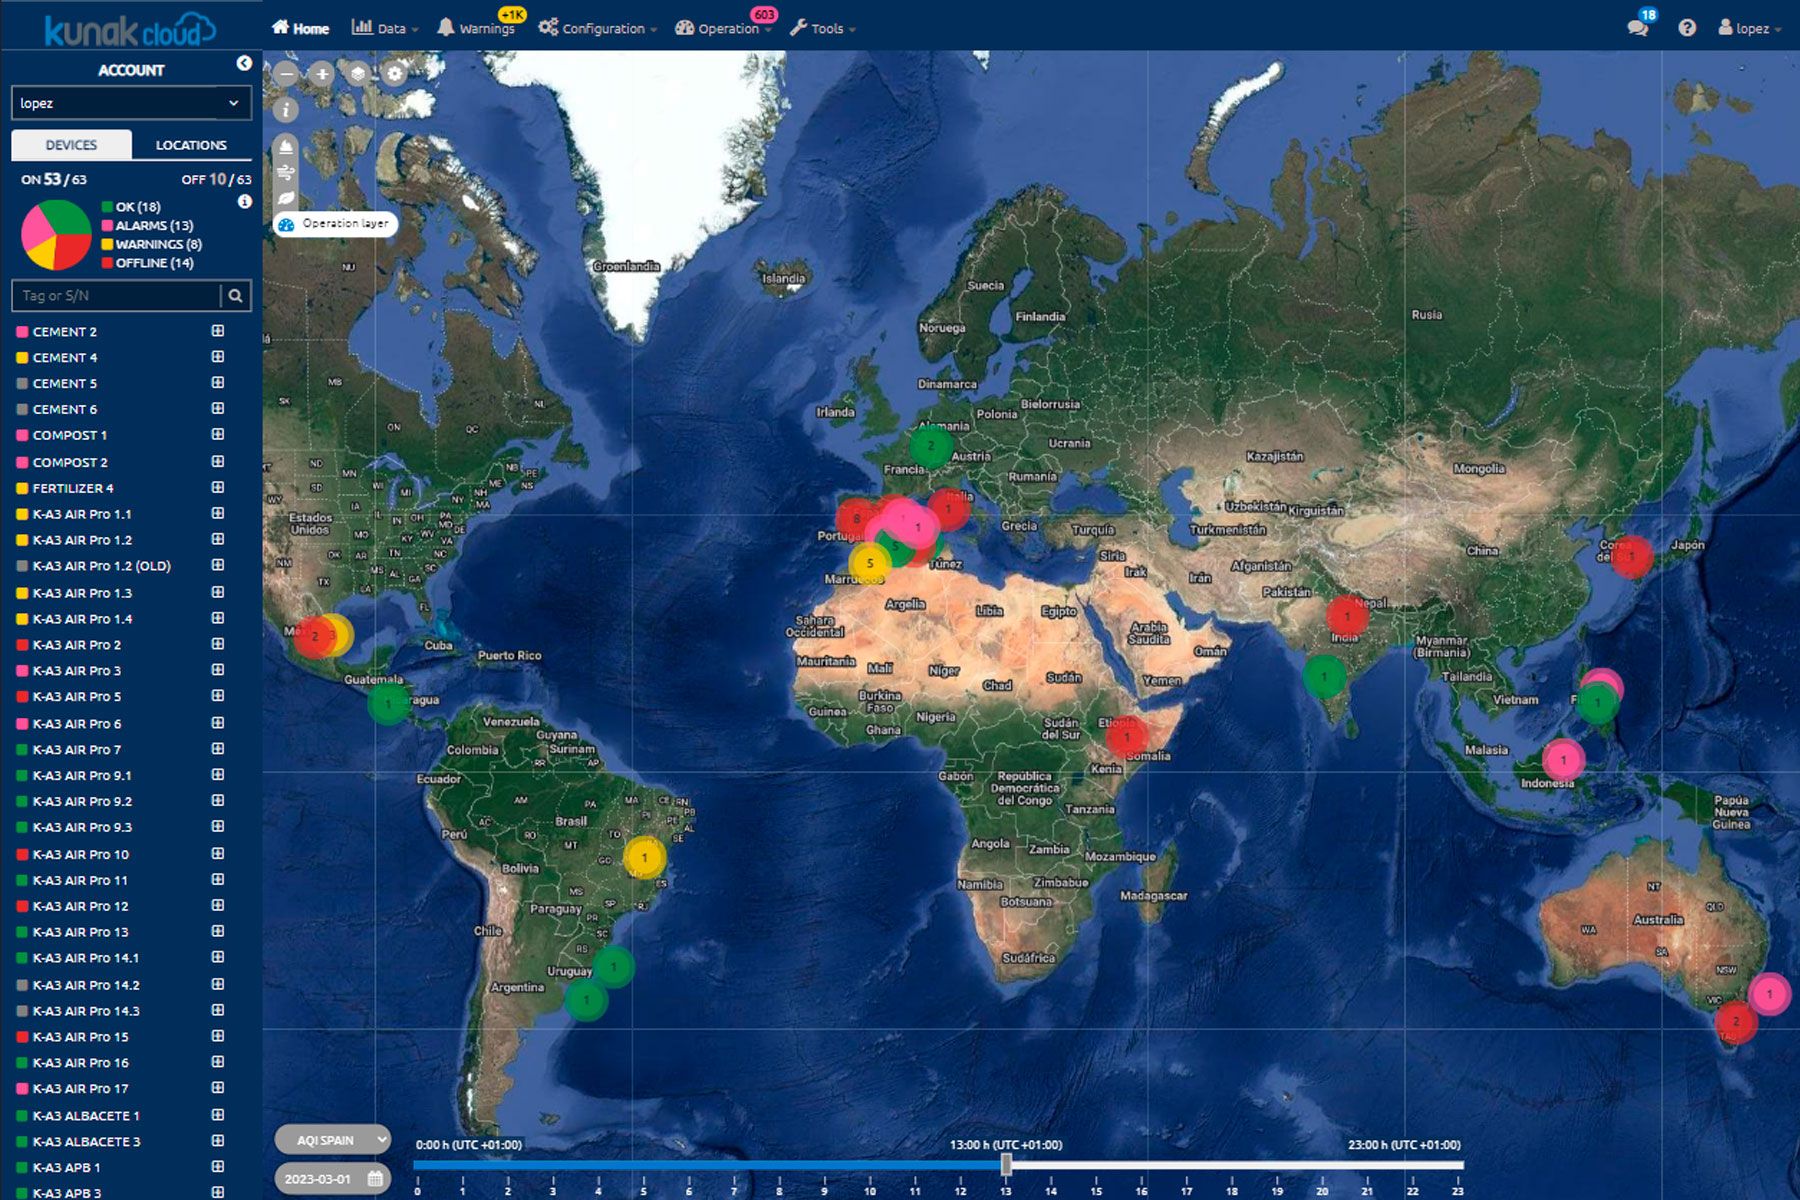
Dashboard
View your devices on a map, their status and the latest measurements.
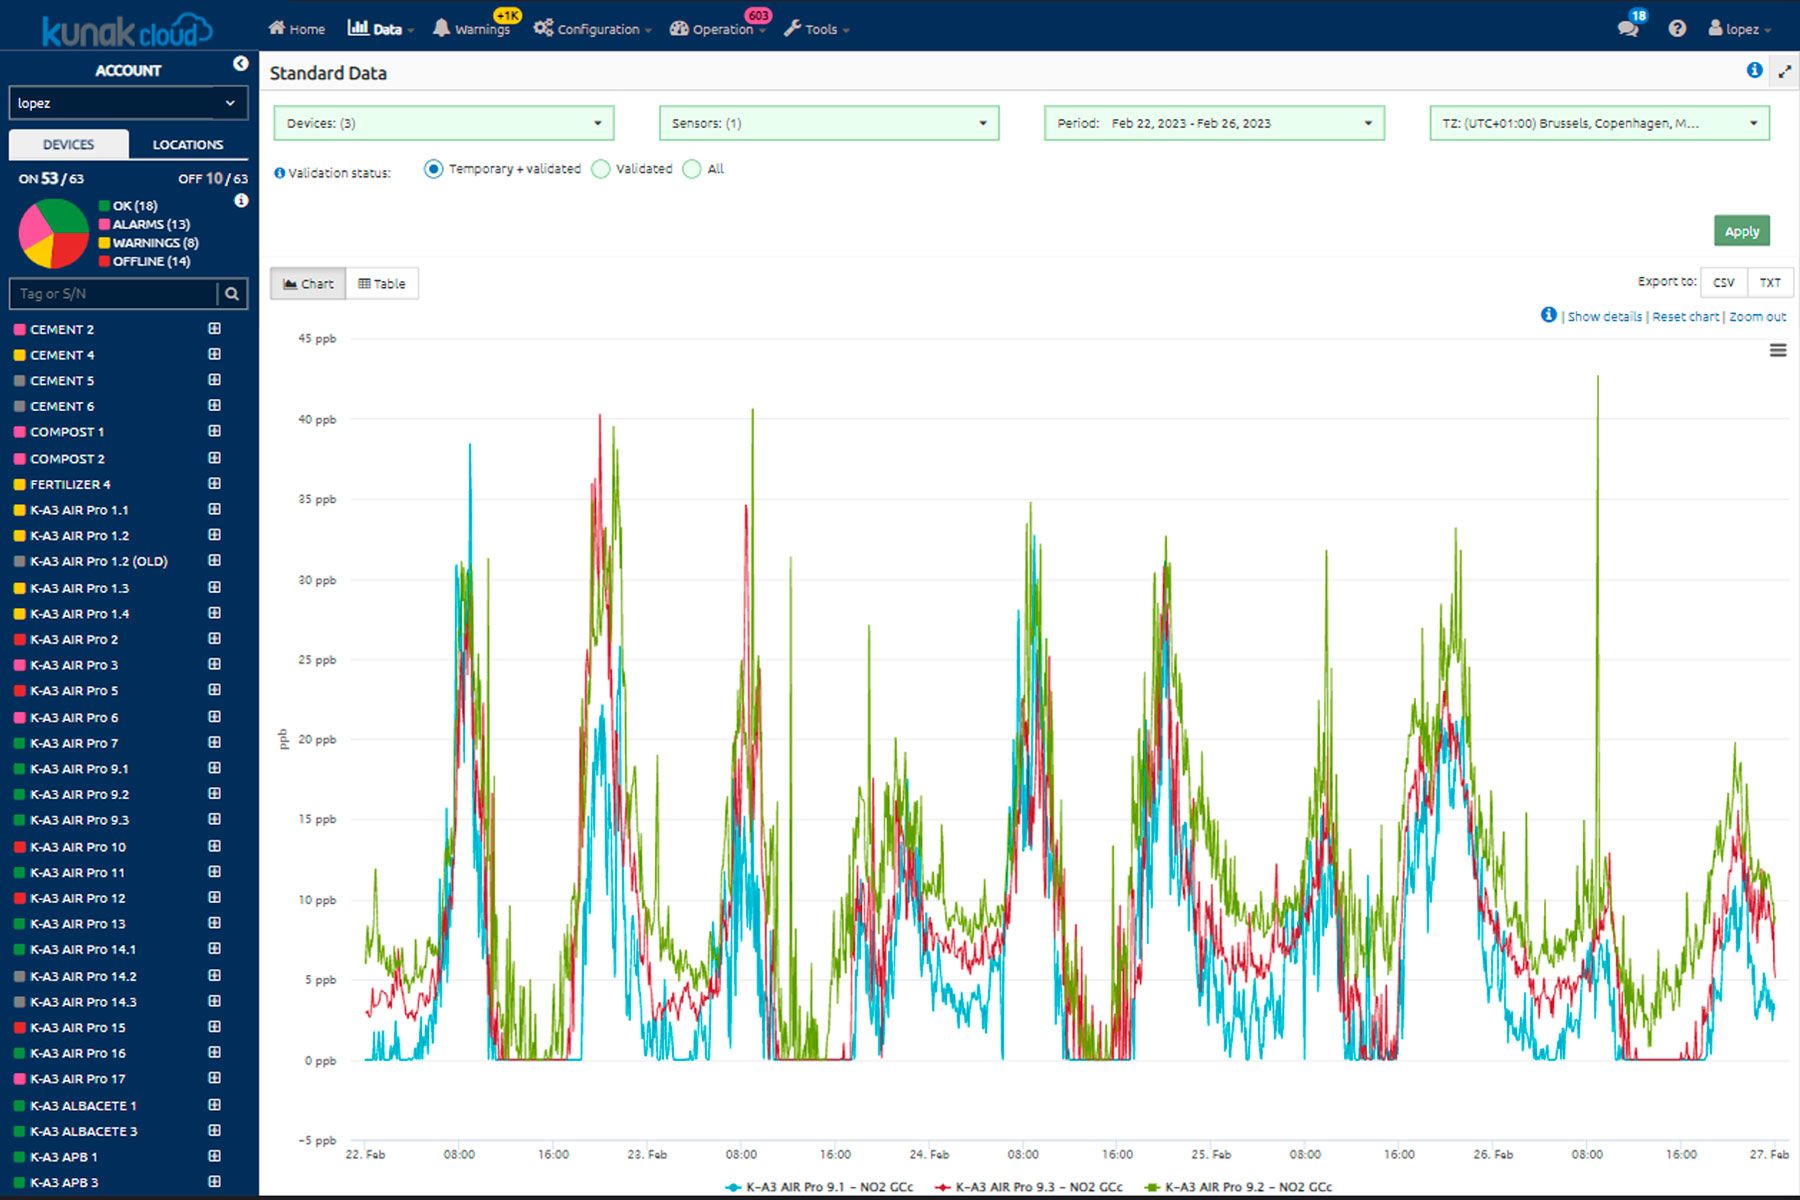
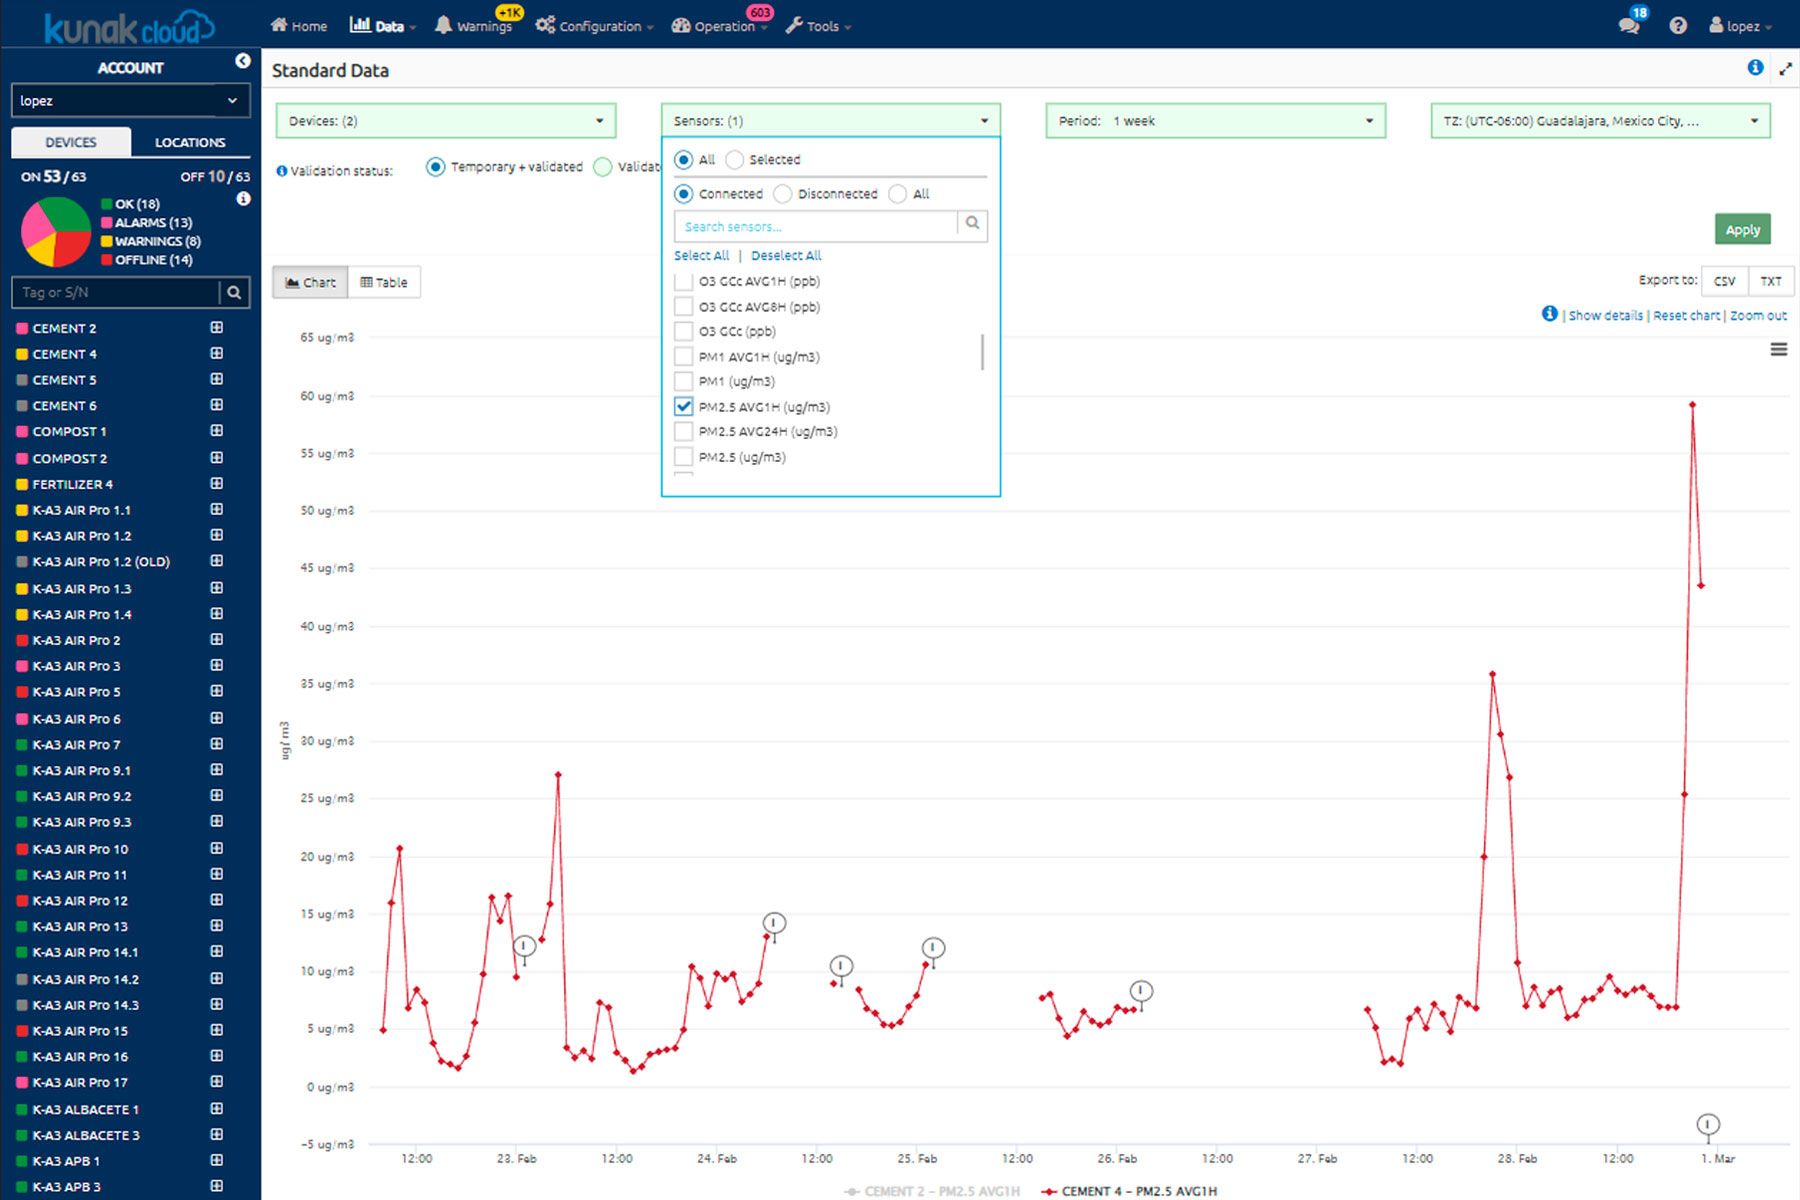
Basic analytics
View standard data, hourly/daily average calculations and basic statistics.
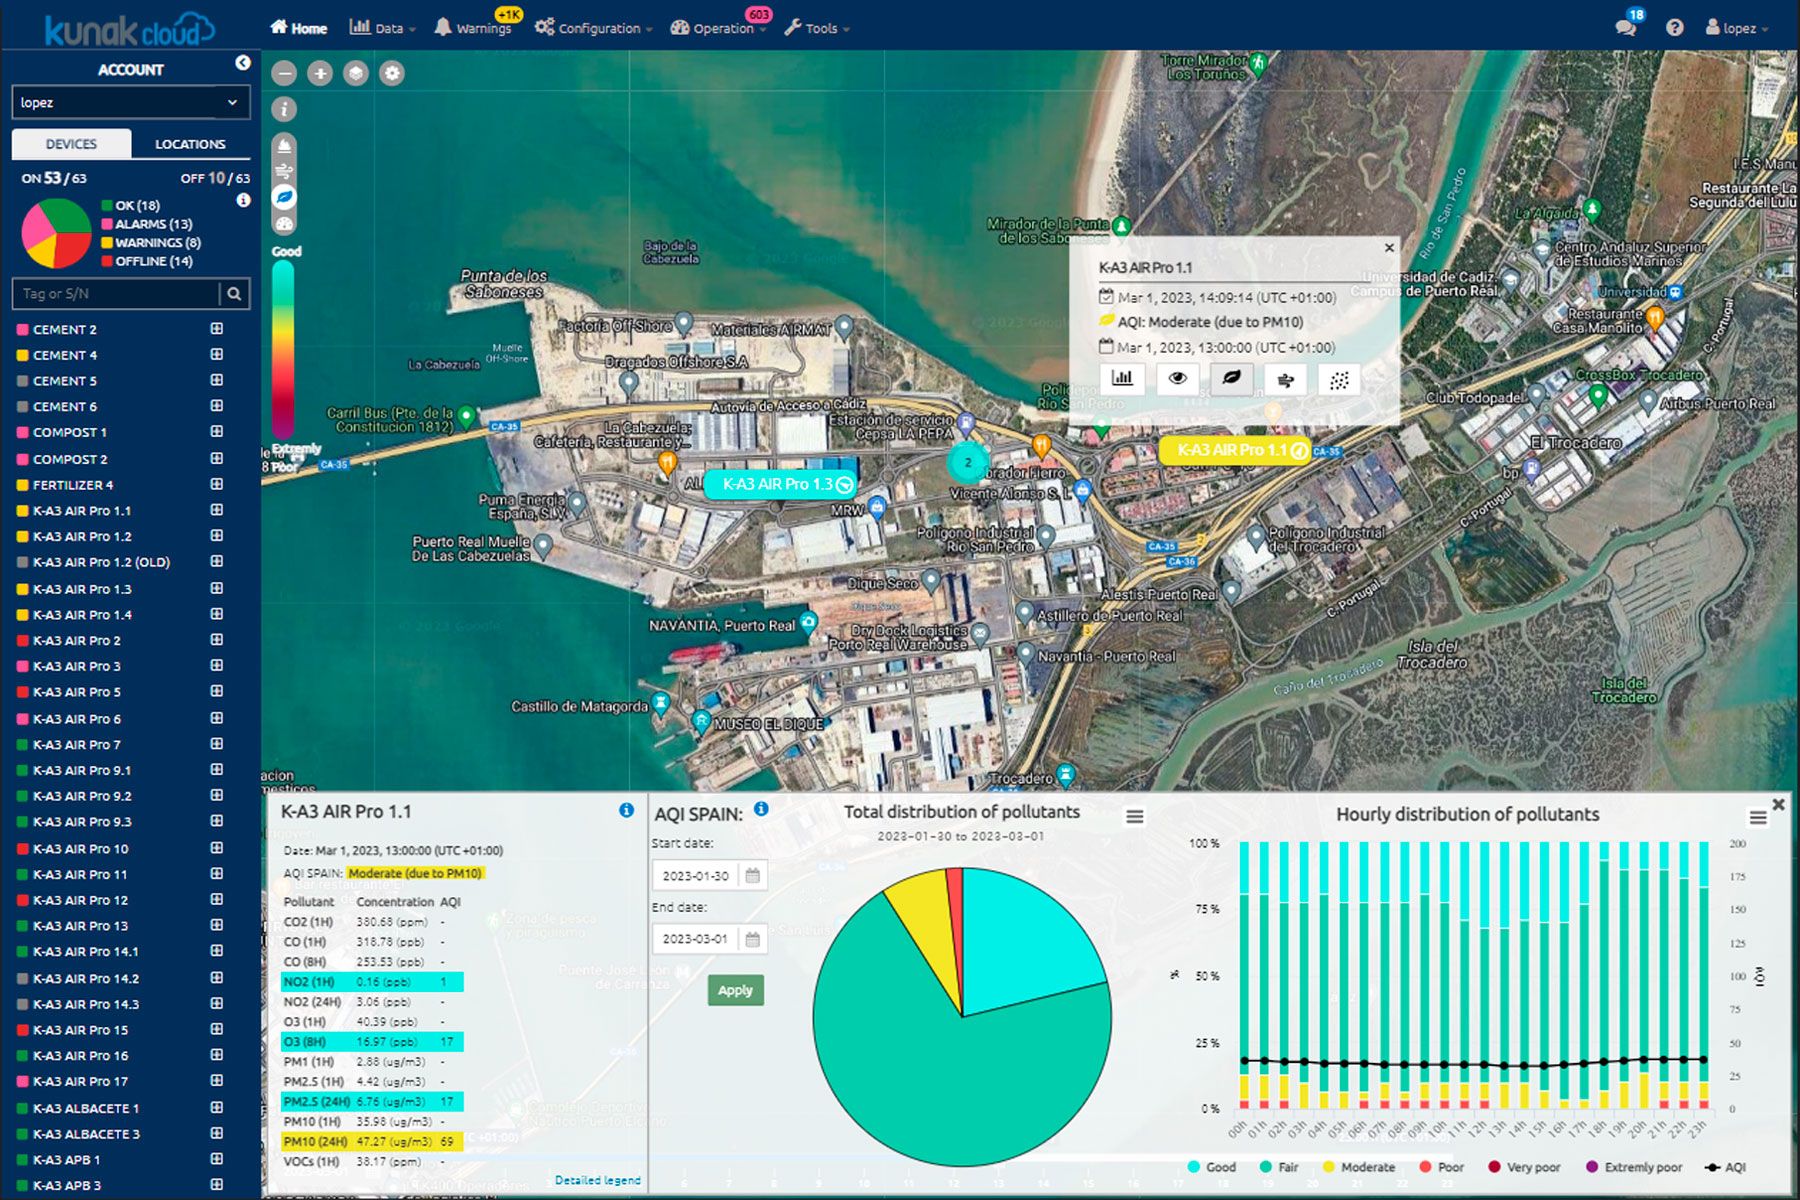
Air Quality Index
Display of standard data, calculations of hourly/daily averages and basic statistics.
Automatic invalidation
Automatic pre-invalidation of data in case of sensor malfunction.

Alert system
Remote configuration of warnings for threshold exceedances.
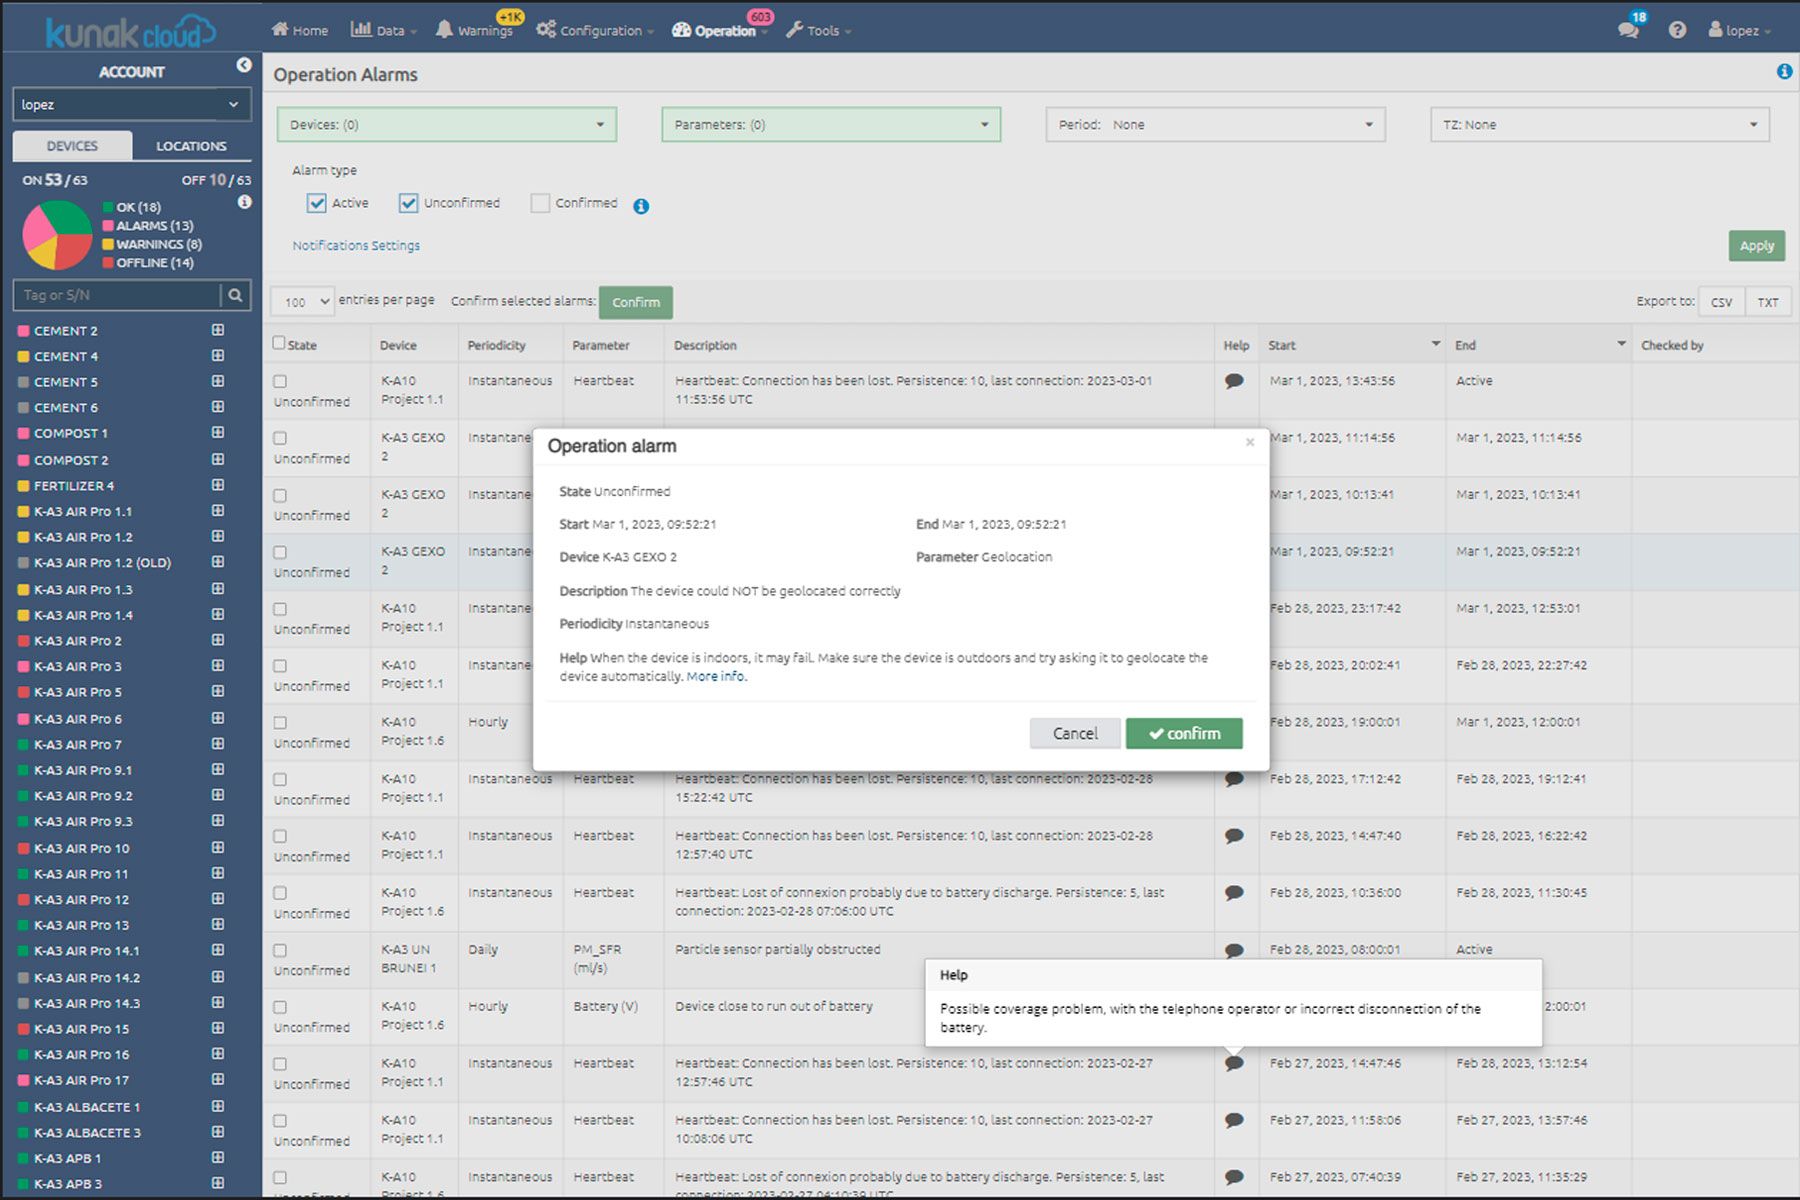
Error detection
Automatic detection of errors, anomalies and decalibrations, notifying them and proposing advice on how to solve the problem.

CMMS
Computerised maintenance management system to facilitate the maintenance of devices, recording any maintenance work.
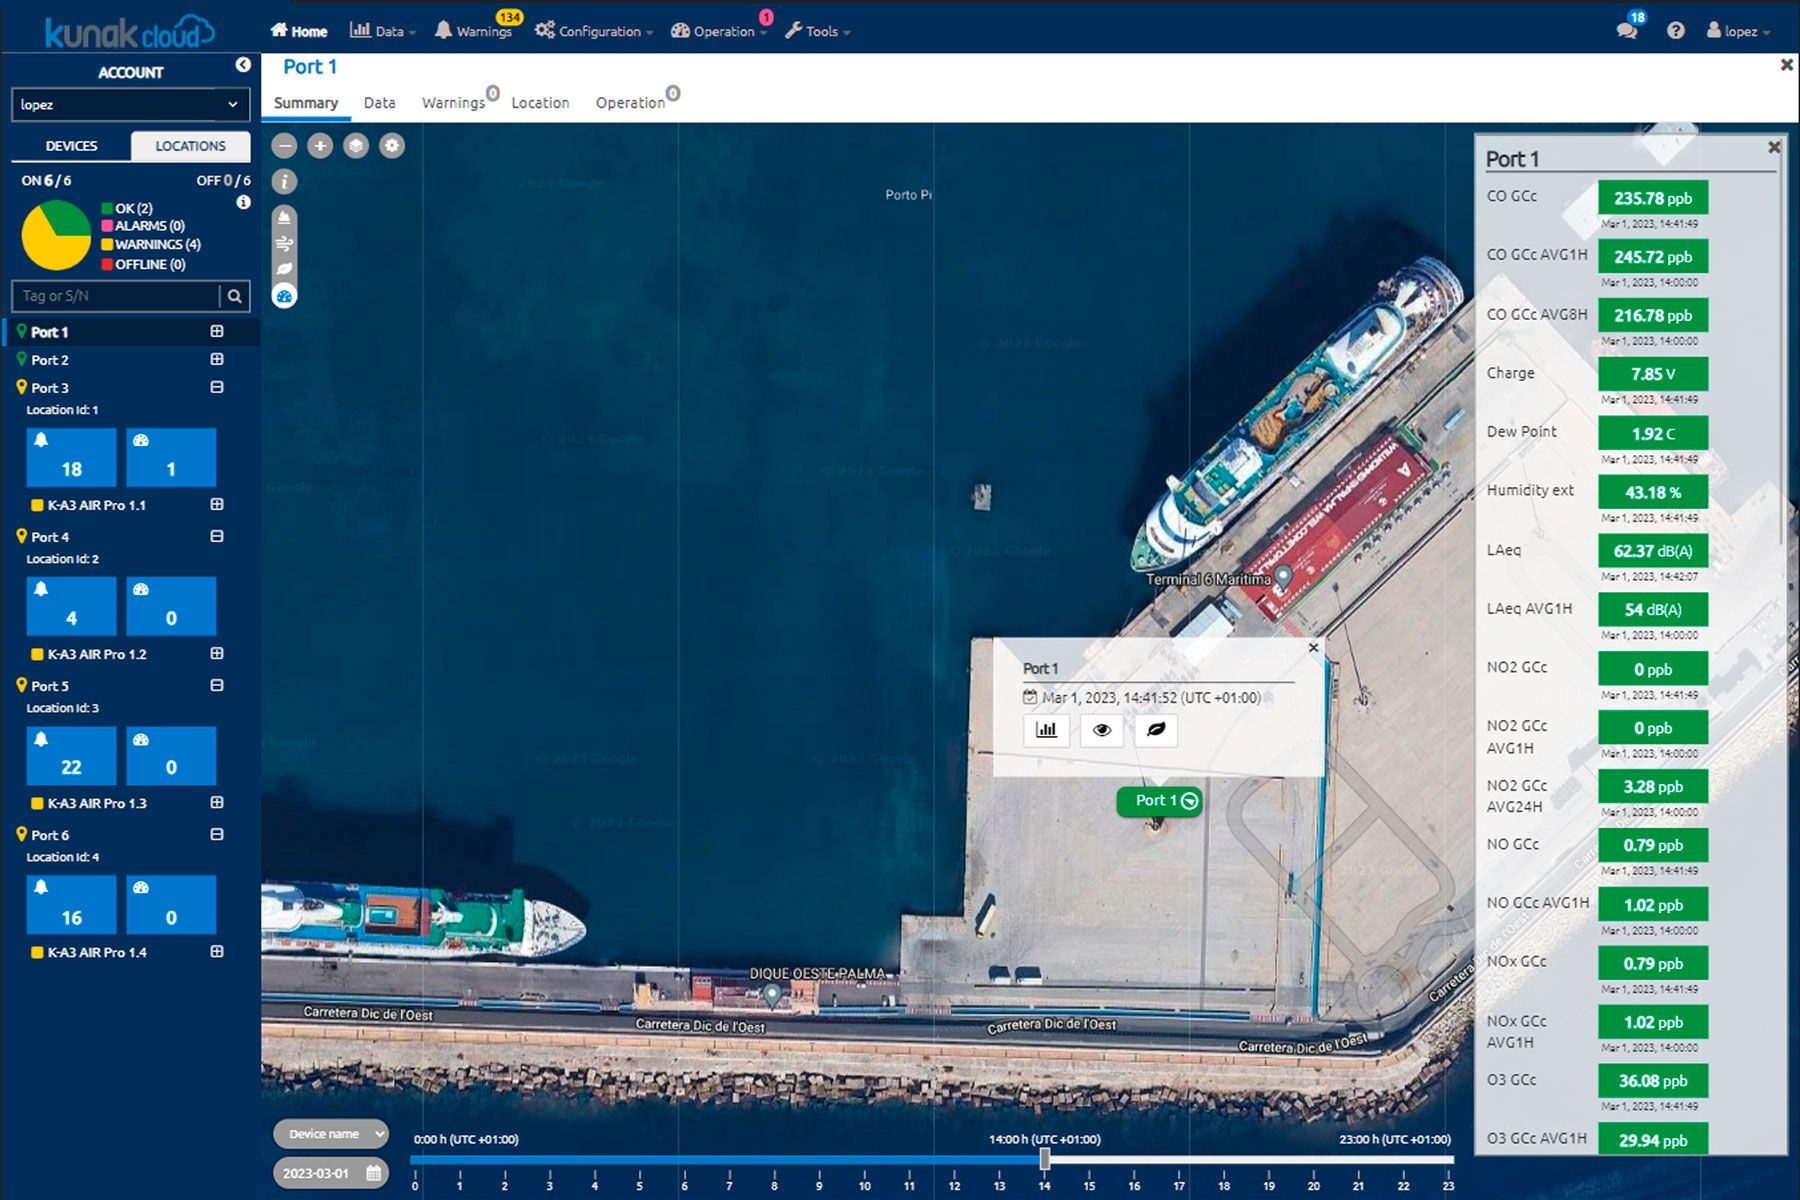
Locations
Manage air quality data by assigning device locations to specific points.
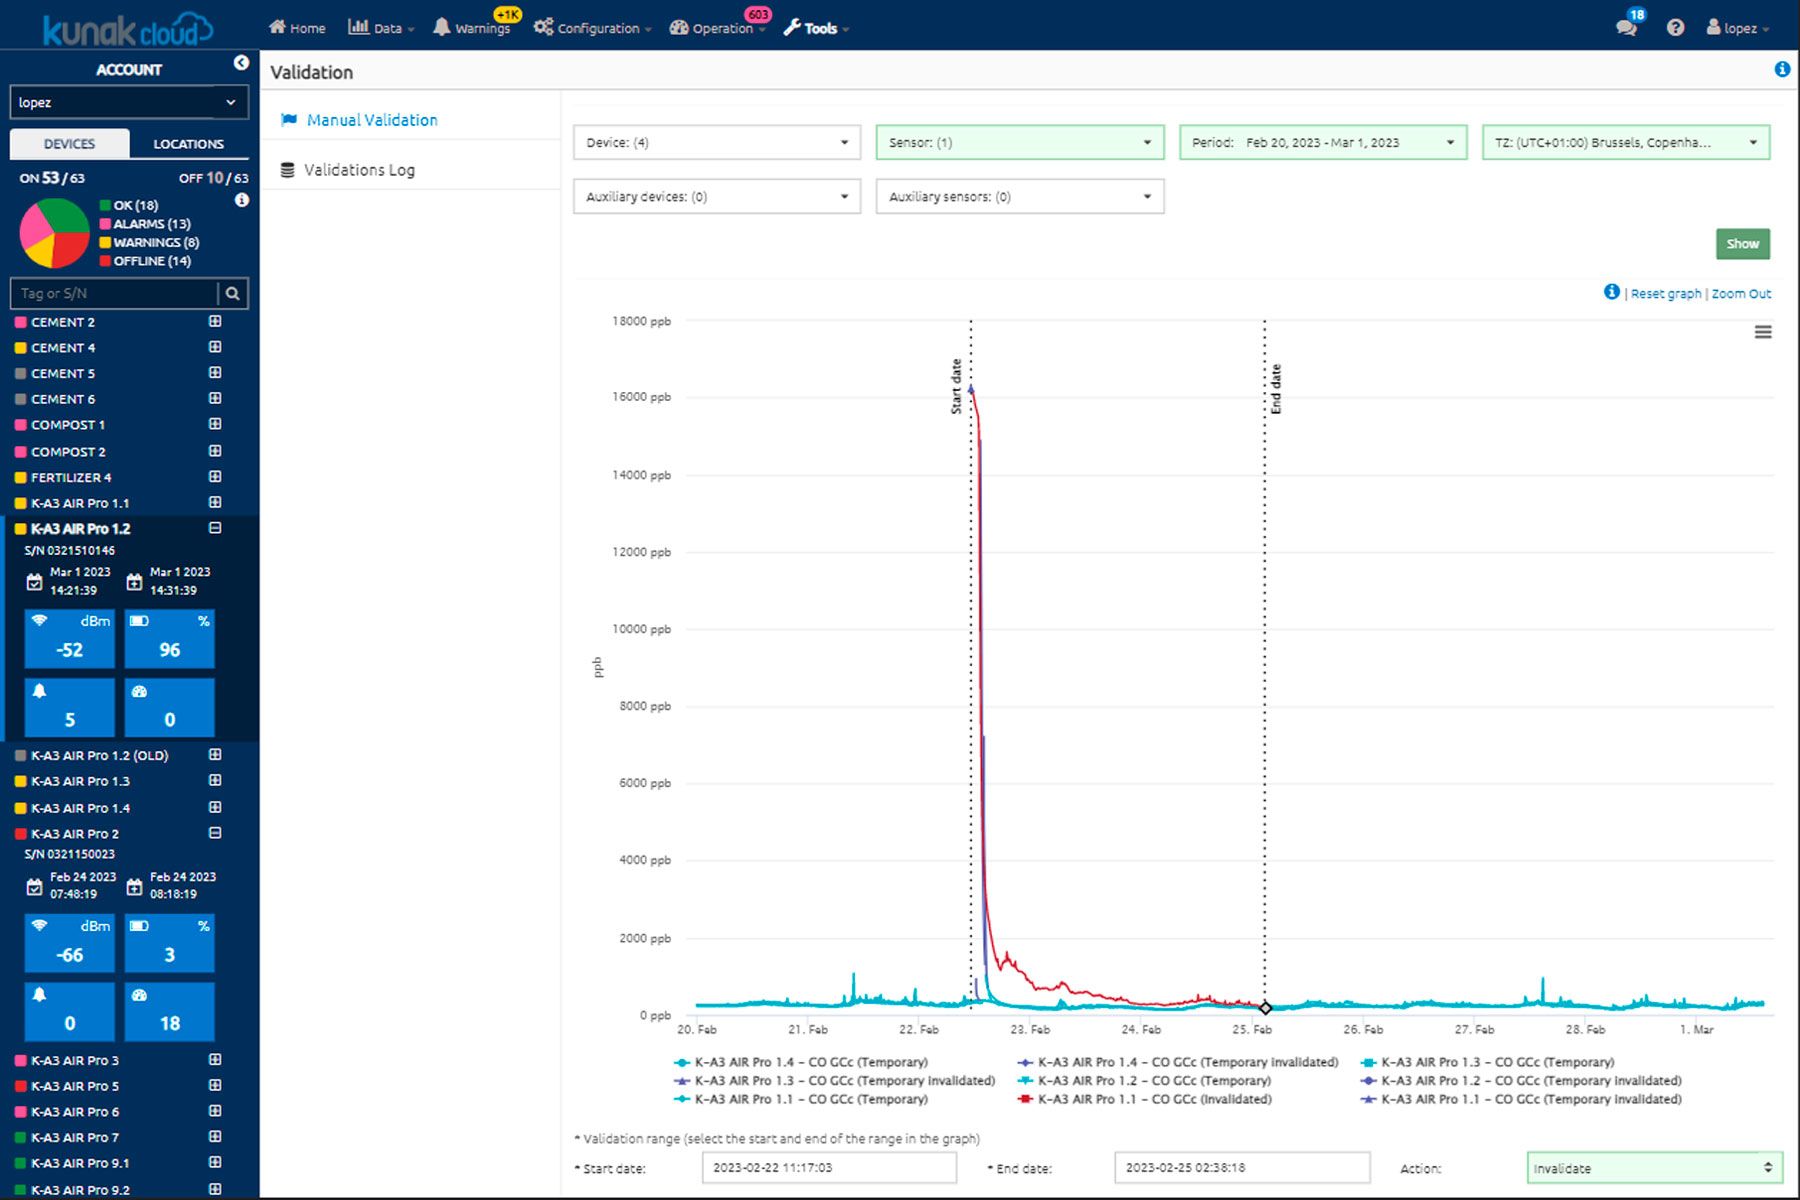
Data validation
Simple, manual data validation to clean data sets and perform advanced analytics with reliable data.
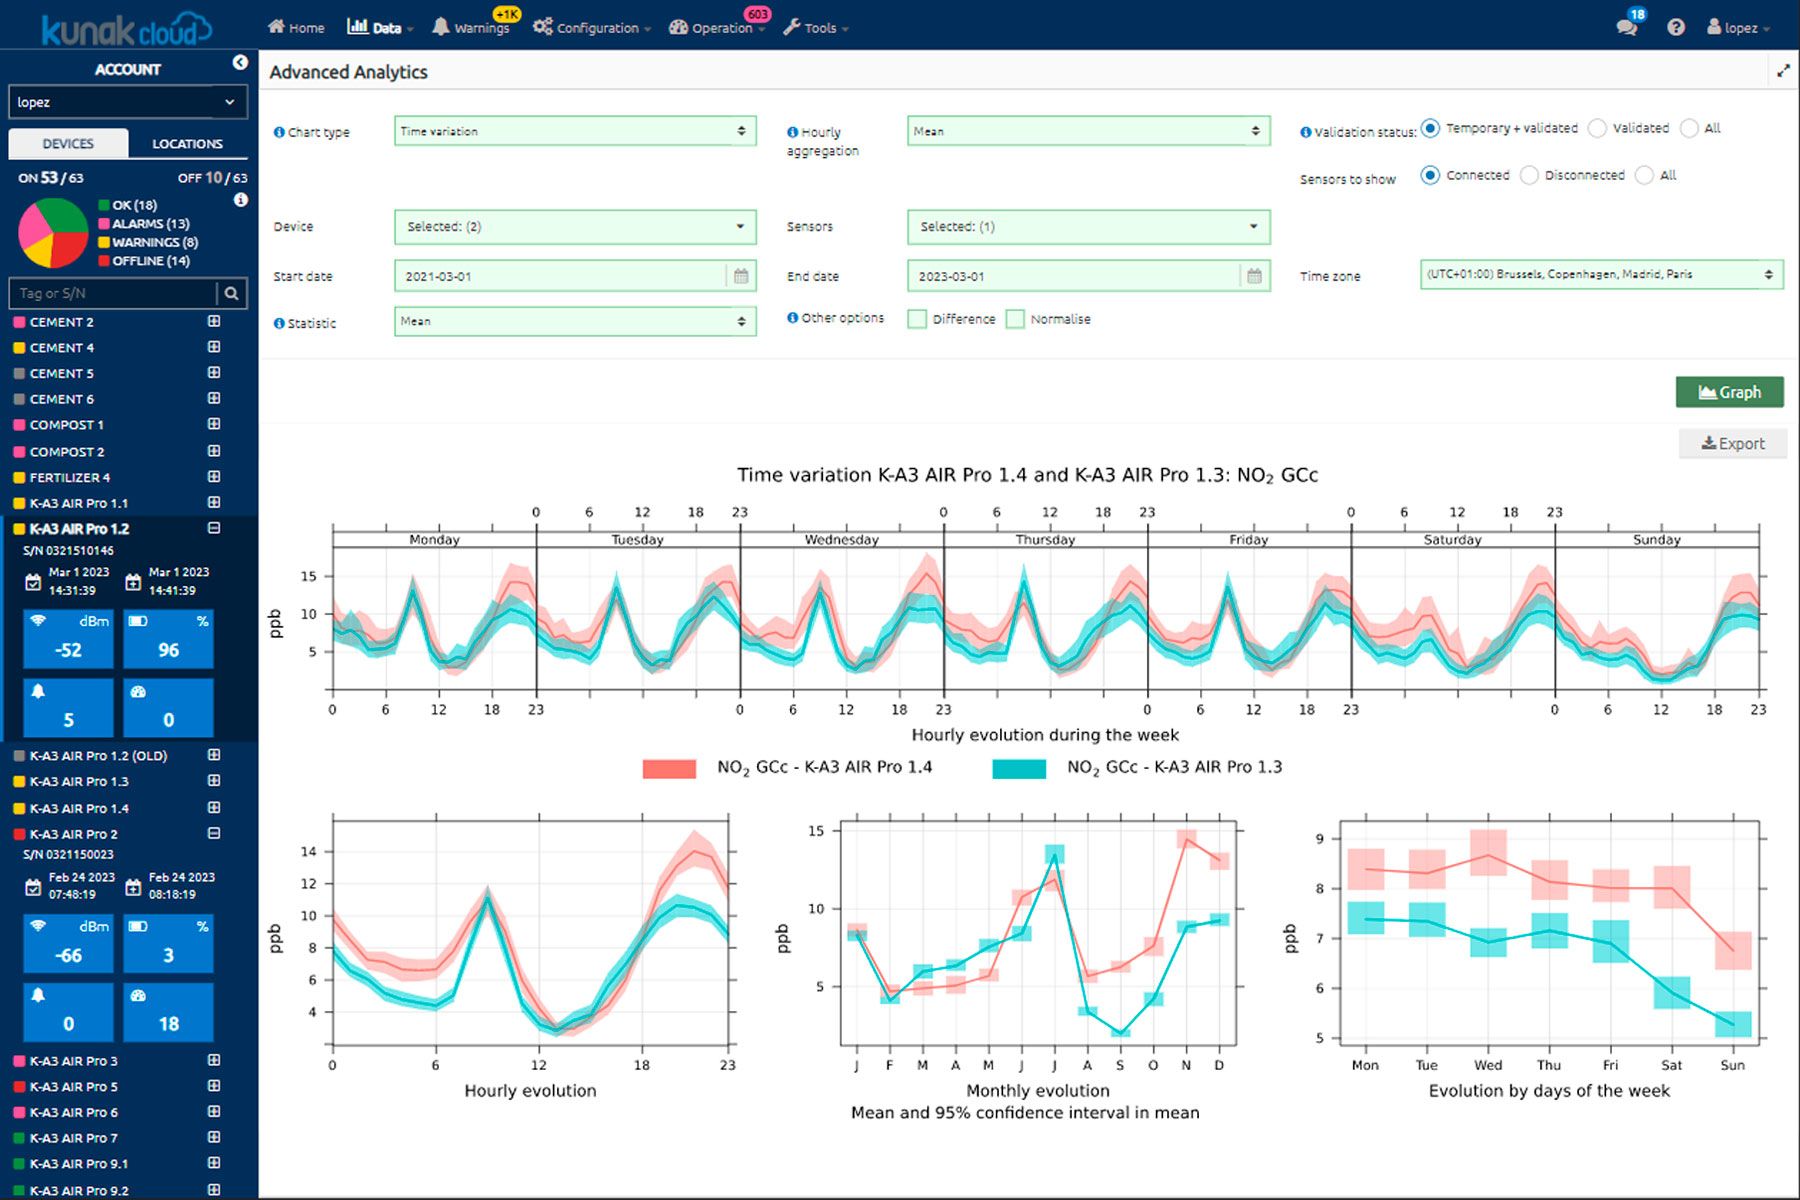
Advanced analytics
Advanced analytics from the OpenAir suite such as calculation of basic statistics, pollutant time plots, temporal variation, wind plots and many more.

External data sources
Integration of other data sources in real-time or by importing files.

Customised reports
Easy creation of air quality reports automatically for one device and/or a whole network.

Heat mapping
Identify hotspots in an area and variable heat maps to see how they evolve over time.

Contamination sources
Detection of pollution sources through pollution roses and polar graphs directly on the map.
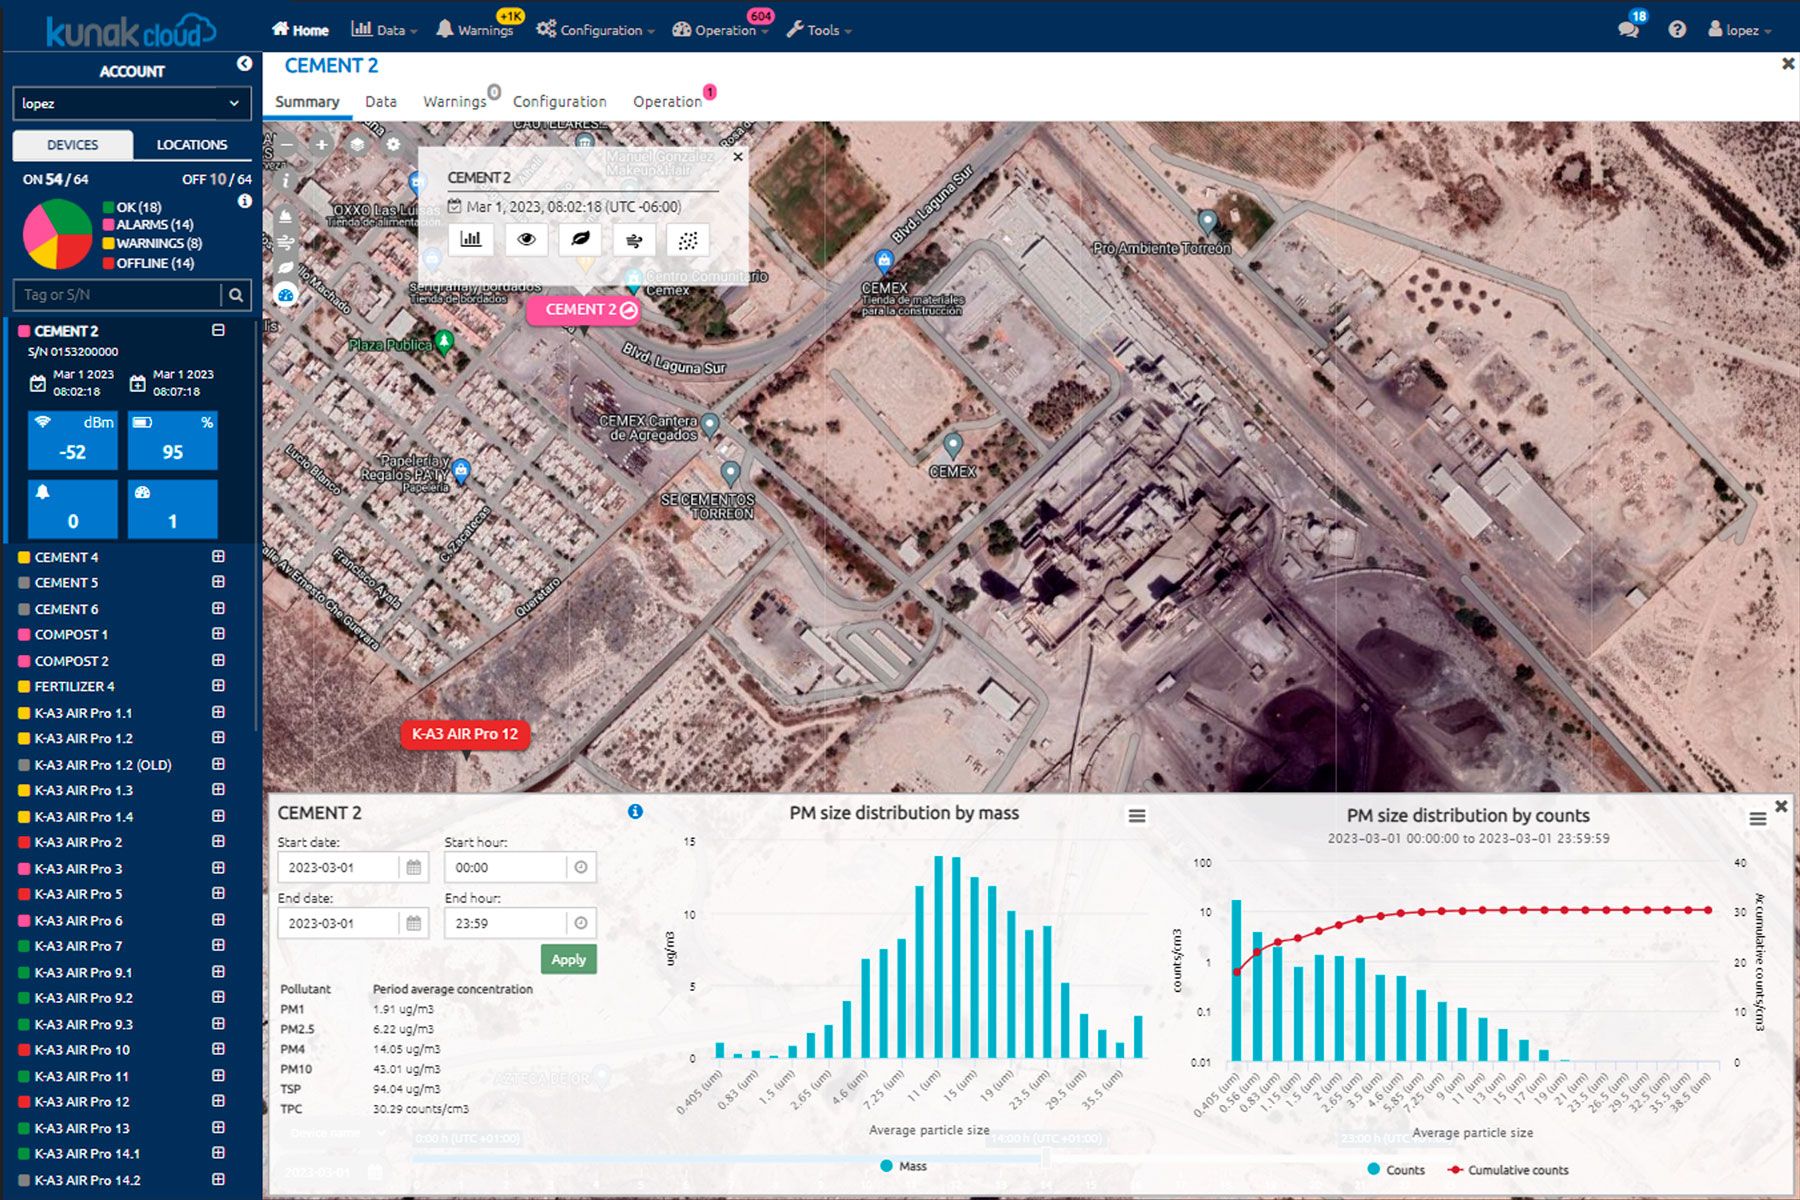
Particle counting
Particle size analysis tool including size distribution graphs by mass and by counts.
Case studies
Brazil’s first Low Emission District (LED) in Rio de Janeiro to improve air quality and urban health
Respirar Fundo, the project revealing what air Portuguese schoolchildren breathe
Smart dust monitoring at Northparkes mine (Australia)


Frequently asked questions
What area does each device cover?
Regarding coverage, it is important to understand that Kunak devices perform point measurements. There is no defined “coverage radius”, as they measure the concentration at the exact location where they are installed. The spatial representativeness of that measurement depends on multiple factors, such as terrain, nearby emission sources and meteorological conditions.
Are Kunak devices ATEX certified?
Kunak devices are designed for the perimetric monitoring of diffuse emissions or leak detection in areas not classified as ATEX.
They can be adapted to operate in explosive-risk environments, complying with ATEX Zone 1 requirements, provided the system is properly configured.
How often are the cartridges replaced and software renewed?
The lifespan of each cartridge depends on the sensor type and environmental conditions, typically ranging from 12 to 36 months. More details can be found in the catalogue.
Kunak Cloud services are renewed annually to maintain updated analysis, calibration, and data traceability.
Is the device portable or fixed?
Kunak devices can be installed on lamp posts, walls, masts, or tripods.
Thanks to their lightweight and modular design, they can be easily relocated by detaching the base and reattaching it elsewhere.
How often should the device be calibrated?
Sensors are factory-calibrated and supplied with an official calibration certificate.
To maintain accuracy, a remote calibration or adjustment is recommended every three months or after relocation or seasonal changes.
What calibration options are available?
Calibration can be performed through:
- co-location with a reference station,
- gas hood calibration with standard gas cylinders, or
- remote adjustment using historical data.
The method depends on the project requirements and available budget.
Can data be obtained locally (Modbus)?
Yes. All Kunak devices include Modbus RTU RSxx protocol, allowing local data transmission and reading without relying on internet connectivity.
How does the device communicate?
The system transmits data via cellular (4G/3G), Ethernet, Wi-Fi, or Modbus, adapting to the available network infrastructure at each site.
What is the battery life?
Devices include an internal backup battery providing between 3 and 30 days of autonomy, depending on the configuration and active sensors.
At what height should the device be installed?
Installation is recommended at a height of 3–4 metres above ground to ensure representative measurements and prevent interference or vandalism.
Does the device have internal memory?
Yes. It features high-speed internal memory capable of storing data for up to 15 days without an internet connection, ensuring data continuity.
Can meteorological probes be connected?
Yes. Kunak AIR Pro supports up to 6 meteorological probes, and Kunak AIR Lite up to 2, depending on the model.
This allows correlation between environmental variables and pollutant concentrations.
Can it be installed on a vehicle or drone for mobile monitoring?
Yes, provided the speed does not exceed 20 km/h. This ensures measurement stability and accurate environmental data capture.
Does this technology have certifications?
Sensor-based devices are not governed by a single certification.
Kunak continuously validates its devices in the field alongside independent bodies.
These tests ensure that the data complies with the European Air Quality Directive and US EPA standards.
Is the Kunak AIR Cloud platform mandatory?
Yes. Kunak AIR Cloud is essential for temperature and humidity compensation, remote maintenance, auto-diagnostics, baseline correction, data validation, and ensuring data traceability.
Can the devices be used indoors?
Yes. The devices can be used in industrial, agricultural, or logistics environments, providing accurate pollutant control even indoors.
What is the difference between the AIR Pro and AIR Lite particle sensors?
- Kunak AIR Pro: 24-channel, MCERTS-certified sensor that measures fine and coarse particles (PM1, PM2.5, PM10) with indicative measurement quality.
- Kunak AIR Lite: 5-channel, non-MCERTS sensor specialised in detecting fine particles.
How are the data integrated with third-party platforms?
Data can be automatically integrated via REST API, Modbus, or FTP, facilitating connection with external environmental or industrial management systems.
What is the difference between calibration and correction?
- Calibration adjusts the sensor’s response against a traceable reference (reference station or certified gas) to determine uncertainty.
- Correction modifies the sensor’s response without an external reference to reduce error or drift but doesn’t quantify uncertainty.
In summary, calibration uses an external reference, while correction is an internal adjustment to maintain sensor reliability. More information on page 35 of the catalogue.