1. INTRODUCTION
1.1 About this document
This manual explains how to install, configure and operate the Kunak AIR Pro, an Air Quality Solution for continuously monitor ambient air pollution. All the information, procedures and techniques described in this document are propriety of KUNAK TECHNOLOGIES S.L. The contents of this manual are subject to amendments without prior notice. Please, check the last version available in the support section, on Kunak Cloud.
1.2 Glossary
· Kunak AIR Pro: Device that takes the data from the sensors and transmits it to Kunak Cloud.
· Kunak Cloud: Cloud web platform to consult, analyse data, status of the network, reports.
· API Rest: Way to transmit the data of the Kunak Cloud to another platform.
· S/N: Serial Number.
· P/N: Part Number.
· CO: Carbon monoxide.
· CO2: Carbon dioxide.
· NO: Nitrogen oxide.
· NO2: Nitrogen dioxide.
· O3: Ozone.
· SO2: Sulfur dioxide.
· H2S: Hydrogen sulfide.
· NH3: Ammonia
· VOCs: Volatile Organic Compound.
· PID: Photoionization detector.
· Cartridge slot cap: Cover to protect the cartridge connectors.
· Measurement range: Concentration range measured by the sensor.
· Resolution: Smallest unit of measurement that can be indicated by the sensor
· Temperature range: Interval of temperatures that the sensor could be exposed to.
· RH range: Humidity transients may affect the readings of some sensors reducing their performance.
· Operating life: Lifetime of the sensor in normal conditions. Long exposures to humidity above 85% can damp the sensor and affect the measurements.
· Guarantee range: Limit covered by the guarantee.
· LOD: (Limit Of Detection) Measured at laboratory conditions at 20ºC and 50% RH. The limit of detection is the minimum concentration that can be detected as significantly different at zero gas concentration, based on the metric from the Technical Specification CEN/TS 17660-1:2022..
· Repeatability: Closeness of the agreement between the results of successive measurements of the same measure carried out under the same conditions of measurement
· Linearity: Indicator of the consistency of measurements over the entire range of measurements.
· Performance limit level: Readings below this level can have lower performance than specified. Measured against reference instrument.
· Typical 90% confidence interval: The average of 90% of the hourly measurements obtained in 1 to 8 months field tests between -10 to +30ºC in different countries are below this absolute error comparing to reference instruments.
· Typical precision R²: The average R² obtained between the device hourly measurements and reference instruments for 1 to 8 months field tests between -10 to +30ºC in different countries.
· Response Time: Time needed by the sensor system to reach 90 % of the final stable value.
1.3 Safety Instructions
General safety instructions of the device:
|
|
The Kunak AIR with OPC has a built in OPC that uses an embedded diode laser light source at a wavelength of 658 nm (invisible) and a maximum of 25 mW of power. The OPC is a Class 1 laser product since the user does not have access to the laser source. The user must not open or adjust any parts of the OPC. Removal of the casing may expose the user to Class 3B laser radiation. You must avoid exposure to the laser beam. Do not use if the outer casing is damaged: return to Kunak for inspection. |
|
|
Removal of the external housing exposes the circuitry which contains components that are sensitive to damage by static discharge. Observe precautions for handling electrostatic discharge sensitive devices. |
|
|
This device has built in Li-ion batteries and the user is requested to follow all local and international regulations regarding the handling of such batteries. The batteries are flammable if damaged or punctured. |
|
|
The device is prepared to function and charge the rechargeable batteries supplied by Kunak. Installing any other battery in the device may cause the device to malfunction or even cause damage. |
|
|
This device must be disposed of according to local regulations. We suggest handling it to a specialized electronic recycling facility. |
|
|
Always protect this device from electromagnetic interferences. Strong electromagnetic fields may affect the gas sensors' readings. |


Table 2 – Safety Instructions


2. OVERVIEW
2.1 Description
Kunak AIR Pro is a small, low power consumption device built to remotely measure & control the pollution air concentration of several gases and toxic particles. It provides a wide range of possibilities to maintain and control the environment and the Air Quality. Additionally, it is able to automatically geolocate every sample with an optional built in GPS receiver.
Kunak AIR Pro offers a plug & play solution to keep and manage all your data directly through Internet, thanks to the powerful cloud-based platform Kunak Cloud, where the whole data, alarms, thresholds, remote configuration and calibration capabilities are available through the web interface. Also, a powerful REST API is available to integrate the data into third party applications.
Hence, Kunak AIR Pro Quality Solution is a complete system consisting of hardware (Kunak AIR Pro), wireless communications and a cloud-based software (Kunak Cloud). Advanced proprietary algorithms are running on Kunak AIR Pro device to obtain accurate gas concentration, correcting cross gas effects and environmental conditions.
Kunak AIR Pro can measure up to 5 different gases (per device) with ppb or µg/m³ resolution as well as three particles sizes: <10 µm, <2.5 µm and <1 µm, hereinafter referred as PM10, PM2.5 and PM1. Temperature, Humidity and atmospheric pressure are always measured within the pollutants.
Kunak AIR uses onboard sensors and Kunak embedded algorithm that calculates the concentrations in ppb or μg/m3 locally and in real-time, not using or needing external reference data to calculate gas or particle concentrations.
To get more information about the environment and make more precise conclusions, extra sensors can be installed like an anemometer, pluviometer, sound level meter or WBGT sensors.
Some of the applications in which the device can be used are described in Figure 1 – Kunak AIR Pro applications.

Figure 1 – Kunak AIR Pro applications
To know all the pollutants that a Kunak AIR Pro device can measure, please, contact our commercial team or take a look at www.kunak.es.

Figure 2 – Kunak AIR Pro device
2.2 Key features
· It can measure up to 5 gases and particulate matter at once.
· It can hold up to 5 cartridges which can be easy & fast replaced or combined with others when necessary (no need to unhook the equipment).
· PM1, PM2.5, PM10 particle counting and measurement technology with a total number of particles and particle size distribution.
· (Patent pending) Innovative cartridges system (plug & play replacement). Simply take the old one out and replace it easily with the new one, on the field. Be back online in 2'.
· Every cartridge is individually tested, characterized and factory calibrated to traceable reference standards, with all the information stored on the cartridge to guarantee traceability.
· It is the smallest device on the market with so many parameters that can operate autonomously with only a solar panel, without additional external batteries.
· Temperature, humidity and pressure built in sensors.
· Connect wind, rain, noise, and other sensors.
· Calculation of the AQI
· Intelligent algorithms that compensate for environmental conditions and the aging of the sensor element
· Advanced LCD display to inform the user about the status of the equipment and the sensors.
· Anytime you can plug & play extra environmental sensors thanks to the multiple connectors included in the equipment.
· Multi-Band 2G/3G/4G (LTE-FDD/LTE-TDD/UMTS/HSDPA/HSUPA/HSPA+/GSM/GPRS/EDGE) or Ethernet
· Automatic GPS/Glonass location
· Optionally ModBus
· Extra connections: 4-20 mAh / 0-10V.
· Ultra-low power consumption
· Autonomous operation with its built-in battery and solar panel.
· Compact, rugged & waterproof design IP65 for continuous outdoors operation.
· Long-life rechargeable lithium batteries.
· Easy & Fast installation.
· Access to your data and alarms in real-time.
· Automatic data download to secure server (cloud platform).
· Remote data acquisition system with fail-safe on-board storage.
· Easy integration via API.
· Easy access to data via web.
· Easy calibration: Adjust the baseline and span remotely by the cloud calibration tool.
· Data export, tables and graphs.
· Easy to configure through web or REST API. Remotely configurable access, alerts, thresholds, calibration parameters, reading and transmitting periods and windows.
· Innovative mechanical design. There are NO elements or screws to be lost. All captive, plug & play with a single tool.
· Unibody compact design.
2.3 Technical Data
2.3.1 Mechanical Specifications
|
PROPERTY |
DESCRIPTION / VALUE |
|
|
Device + Solar Shield |
Dimensions |
235 x 270 x 250 mm |
|
Weight |
2.4 ~ 3.4 Kg (depending on configuration) |
|
|
Enclosure |
PMMA & Polycarbonate & Stainless steel |
|
|
Cartridge |
5 sockets for cartridge sensors |
|
|
Connectors |
5x M12 |
|
|
Connector 1 |
M12 x 4 pins female type T |
|
|
Connector 2 |
M12 x 4 pins female type D |
|
|
Connector 3 |
M12 x 5 pins female type B |
|
|
Connector 4 |
M12 x 8 pins female type A |
|
|
Connector 5 |
M12 x 5 pins female type A |
|
Table 3 – Mechanical Specifications

Figure 3 – Device dimensions with solar shield
2.3.2 Environmental Specifications
|
PROPERTY |
DESCRIPTION / VALUE |
|
Operating Temp |
-20 ºC to 60 ºC[1] |
|
Humidity |
0 to 100%RH |
|
IP Rating |
IP65 |
|
Altitude max |
3000 m |
|
Overvoltage category |
Overvoltage category II |
Table 4 – Environmental Specifications
2.3.3 Electrical Specifications
|
PROPERTY |
DESCRIPTION / VALUE |
|
Battery |
Lithium 2.9Ah or 26Ah |
|
External supply |
7 – 12 Vdc (min recommended 12W) |
|
PoE supply |
PoE++ Type 3 |
|
Solar panel supply |
6V, 12W |
|
Autonomy |
Continuous Operation. 24/7 with solar panel or charger |
|
Power consumption |
0.08 to 1.2W depending on the configuration |
|
Communications |
Ethernet or Multi-Band 2G/3G/4G (Bands at 2.5 Communications) |
|
GNSS[2] |
GPS, GLONASS |
Table 5 – Electrical Specifications
2.3.4 Sensors and Proves
|
PROPERTY |
DESCRIPTION / VALUE |
|
Cartridges |
Up to five gas cartridges can be plugged. Each cartridge can carry a CO, NO, NO2, O3, SO2, H2S, CO2 or VOCs sensor. |
|
OPC |
PM1, PM2.5, PM10 particle counting and measurement technology with total number of particles and particle size distribution |
|
Internal status |
Internal temperature, battery level, voltage and current charge, signal level |
|
Environmental built-in Sensors |
Temperature, humidity, atmospheric pressure |
|
Plug & Play extra sensors |
Connector 1: Power Supply 7V to 12V |
|
Connector 2: · K-A3-xx-3: Ethernet PoE. · K-A3-xx-4: Modbus Slave. |
|
|
Connector 3: Sound level meter |
|
|
Connector 4: Modbus Master & (WBGT or Pyranometer) |
|
|
Connector 5: Anemometer & Rain gauge |
Table 6 – Sensors & Proves Specifications
2.3.5 Features
|
PROPERTY |
DESCRIPTION / VALUE |
|
Diagnosis LCD |
Advanced LCD display to inform the user about the status of the equipment and the sensors |
|
Measurement |
Continuous sampling configurable. 3Hz gases, 1Hz particles |
|
Remote management |
Bidirectional configuration of every parameter of the device and sensor network |
|
Low power |
Ultra-low power consumption can be configured for battery length improvement |
|
SIM |
Embedded eSIM and mini-SIM holder |
Table 7 – Features Specifications
2.4 Power Consumption and Duration
The tables below shows the average power consumption of Kunak AIR Pro in the different modes of operation considering a sampling period of 5 minutes and a sending period of 30 minutes.
A low power mode for the OPC (particle sensor) has been designed to enlarge the battery life.
|
Mode of operation |
Battery |
Average consumption |
Average duration[3] |
|
Device On without OPC |
1 Cell –10 Wh |
0.1 W |
70 hours |
|
Device ON with OPC in Low Power |
1 Cell –10 Wh |
0.25 W |
24 hours |
|
Device ON with OPC |
1 Cell –10 Wh |
1 W |
8 hours |
Table 8 – Power consumption
The built in battery has a maximum of 2900 mAh, 10 Wh. To increase battery life and allow 24 hours / 7 days solar panel operation while using the OPC version, the high power rechargeable Li-Ion battery is recommended with a maximum of 26,100 mAh, 93 Wh. In all cases they supply is 3.7 V.
|
Mode of operation |
Battery |
Average consumption |
Average duration[4] |
|
Device On without OPC |
9 Cell – 93 Wh |
0.1 W |
30 days |
|
Device ON with OPC in Low Power |
9 Cell – 93 Wh |
0.25 W |
9 days |
|
Device ON with OPC |
9 Cell – 93 Wh |
1 W |
3 days |
Table 9 – Power consumption with high power pack
Battery durations may last 15% less than specified at the tables above if a VOCs cartridge is connected.
2.5 Communications
Depending on the version acquired, the devices can work with different technologies for transmitting the data to Kunak Cloud or the On-premises server. The amount of data depends on the number of sensors supplied with Kunak AIR device and the sampling period of the sensors, for example for a device configured with a sending period of 5 minutes and a sampling period of 5 minutes, the device will consume less than 10MB/month.
The different technologies of communication can be one of:
· 2G/3G/4G
o LTE-TDD: B34/B38/B39/B40/B41
o LTE-FDD: B1/B2/B3/B4/B5/B7/B8/B12/B13/B18/B19/B20/B25/B26/B28/B66
o UMTS/HSPA+: B1/B2/B4/B5/B6/B8/B19
o GSM/GPRS/EDGE: 850/900/1800/1900MHz
· Ethernet
It is possible to have wired communication Modbus RTU Slave, but it will be combined with the 2G/3G/4G technology to transmit the data also to Kunak Cloud.
2.6 Device Security
Safety is a fundamental factor in all Kunak designs, being implemented from the design of the device to the installation, operation and maintenance, both at a physical level (hardware), as well as software, communications and action protocols.
Thus, this safety protocol begins with the most basic but very important elements, such as the gas cartridges. In this way, each of the cartridges, which store all the test and calibration parameters during the manufacturing process (there can be more than 100) in order to guarantee their traceability and the accuracy of their measurements, incorporates an AES128 encrypted memory to store all this information so that it can only be read by a validated KUNAK station after a series of testing and validation mechanisms of the stored information before the cartridge can be approved.
The device is then initialised against the server, validating its credentials, ensuring that it is a Kunak manufactured device and cannot be supplanted by any other, as in addition to verifying that the device is real, the same is done with all the cartridges connected to it.
Once it starts working, all the measurements are stored in an encrypted internal file system, which is sequentially erased as soon as it is confirmed with the server that it has received all the measurements correctly.
Regarding communications, a fundamental difference is that these are produced asynchronously by the device and are only made against a defined IP (or URL) so that the device has the modem off all the time except when it decides to initiate communication with the defined IP. Only then will it listen for possible configuration messages coming from this IP, correctly encrypted and with their correct codes to the responses made by the device. This prevents communication attempts or attacks on the device from being made when the modem is switched off.
In addition, if the device is working with the electronic e-SIM, a dynamic IP and a private APN (so it is not accessible from the public network), which are another very important layer of security.
Finally, the Kunak devices do not collect any personal information, they only capture, through their sensors, information of the environmental nature or signals to control the device itself (battery, signal level, panel charge, etc.).
In this way, the hardware, electronics, communication and security protocols and communications technologies incorporated in the Kunak AIR make it the most technologically advanced, reliable, robust and innovative product in the world for air quality measurement systems.
2.7 How to Store and Recover Data
Kunak AIR device has been designed to work in very low power consumption mode while the gas sensors are sampled continuously. Every “sampling period”, Kunak AIR will produce a valid reading which is the average of all the valid samples and the time stamp when the averaged has been done. If a sample or reading is considered “invalid” by KUNAK’s proprietary algorithm, it will be invalidated. Every “sending period”, Kunak AIR will send the information wirelessly to the Kunak Cloud and, if the communication is successful, all the measurements will be deleted from the device and stored in Kunak Cloud.
Kunak AIR has an internal flash memory that can store all the readings until the information is sent to the Kunak Cloud. If a communication cycle fails, the readings will be stored in the flash memory until the next successful communication. It is not recommended to set a sending period 500 higher than the sampling periods to guarantee full integrity of information, even with communications failures. Minimum sampling period is set to 10 seconds. Then, when fast readings are desired, for example in mobile applications, a recommend sending period would be between 30min and 1h maximum.
Both, the “sampling period” and “sending periods” are configurable remotely through Kunak Cloud.
Once the information is sent to Kunak Cloud, it is stored in the database and can be recovered through the web interface, exported in .CSV, .TXT formats or through the REST API. Please, refer to the Kunak Cloud manual for more information regarding the cloud-based software and how to analyse, operate and recover data.
Please, note that to start working correctly, Kunak AIR needs to initialize when powered up and make a successful connection to Kunak Cloud before start storing data. So, the user must be sure that there is enough mobile coverage when switching on the device.
|
|
Be aware when analysing data that each sampling period is an average. It is calculated from the last sample to the new one. The average timestamp is set at the end of the sampling time. If the sampling period is 5 minutes, Kunak AIR device will calculate the average, for example, from 12:08 to 12:13 and the timestamp of that measure will be 12:13.
|

In order to offer the data with the maximum possible reliability, the device has a data discrimination mechanism after a connection to the Kunak Cloud to prevent certain electromagnetic interference (EMI) that can alter the data being sampled at that moment. Once the connection is made, the device will discard the following data in the next 2 to 5 minutes. The range of discarded data, variates depending on the sampling period and the sending period configured. The “Sampling period” and the “Sending period” can be changed through Kunak Cloud. An example of how much time the data is discharged (Guard period) regarding the “Sampling” and “Sending period” is shown below.
|
Sampling period |
Sending period |
Guard period |
|
5 mins |
30 mins |
2 mins |
|
10 seg |
30 mins |
5 mins |
Table 10 – Examples of Guard period regarding the Sampling and Sending period
Therefore, if it is desired to have a very small sampling period of e.g. 1 minute, it is recommended that the sending period is large, at least 1 hour, to minimise the number of data that are lost due to the guard period.
3. QUICK START GUIDE
3.1 Package Content
The Kunak AIR Pro is always supplied mounted into the solar shield and with an eSIM preconfigured to work with it. To install and configure a SIM card, please refer to the manual on how to change the SIM card.
|
|
Gas cartridges, probes and power supplies are sent separately. |
Standard Kunak AIR Pro Package:
|
· 1x Kunak AIR + Solar Shield (more information about the version on the label of the box) · 5x Cartridge slot cap (plugged) · 1x Particle sensor cover kit[5] · 1x Wall or mast mounting kit · 1x Stainless steel hose clamp · 1x Allen key 4 mm · 1x Quick start guide |
|

If any damage has been produced during transport, please, contact KUNAK or your local distributor.
3.2 Required Tools and Equipment
To install the Kunak AIR Pro, you need the following tools:
· 4-mm Allen Key (provided).
· (For mast installation) Screwdriver or 6 mm socket wrench.
· Cutter for the stainless-steel hose clamp.
· (For wall installation) Screwdriver and 4 bolts (minimum 2).
3.3 Parts of a Kunak AIR Pro Station

Figure 4 – Parts of a Kunak AIR Pro
|
1. Inlet Particle sensor 2. Support holder 3. Outlet Particle sensor 4. Metallic grid 5. Solar Shield 6. External Temp, Humidity, pressure and dew point sensors |
7. Cartridge 8. Power button 9. Connectors for power and optional probes 10. LCD display 11. Display Buttons 12. LEDs indicators |
3.4 Power On/Off Button
Please note that the button cuts off all power to the device so that the gas sensors are no longer powered and will have to be restabilised when powered on.
|
|
|

3.5 LEDs Indicators and Display Buttons
The LEDs below the display indicate the current status of the device.
|
|
|

There are two buttons below the LCD that will change the LCD messages. To access the functionality of the buttons, for the upper symbols briefly press the button, and for the lower symbols, press the button for 5 seconds.
|
|
|

3.6 Installation of the Smart Gas Cartridge
|
|
The VOCs sensor cartridge ionises ambient air generating small amounts of O3, so avoid installing it near O3, NO2 or SO2 sensors. For example, place the VOCs sensor in slot 5 and the O3, NO2 and SO2 sensors in slots 1, 2 and 4; avoid placing them in slot 3. |
The cartridge can be installed at any slot of the Kunak AIR Pro device (always with the device switched off). When is turned ON, the device will automatically detect the cartridge and its position showing them at the LCD display. The positions are:
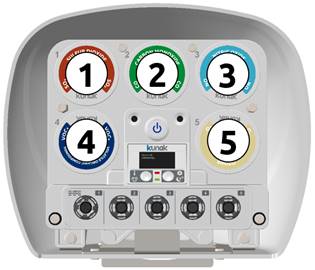

Figure 5 – Cartridges position
3.7 Pluggable Probes or Extra Sensors
There are 5 plugs at the bottom of the Kunak AIR Pro device to connect the power and extra sensors. Each M12 plug is different and only fits its specific connector.
The probes or extra sensors can be plugged to the Kunak AIR Pro device in every moment and some of them depends on the characteristics chosen at the purchase time. The probes will be automatically detected at start-up of the device. The features of each connector are:
· Connector 1 (M12 x 4 pins type T): Power 7V to 12V.
· Connector 2 (M12 x 4 pins type D):
o K-A3-xx-3: Ethernet PoE.
o K-A3-xx-4: Modbus Slave.
· Connector 3 (M12 x 5 pins type B): Sound Level Meter.
· Connector 4 (M12 x 8 pins type A): Modbus Master & (WBGT or Pyranometer).
· Connector 5 (M12 x 5 pins type A): Anemometer & Rain Gauge.


Figure 6 – Probes position
3.8 Checking Before Deployment
|
|
Be aware while installing a cartridge or a probe sensor. · The Kunak AIR device must be powered OFF while plugging/unplugging a cartridge or probe. If the device is powered ON while doing the change, it can damage the sensor or the Kunak AIR Pro station. Press firmly on the cartridge. · Be careful while inserting the cartridges into the device, the pins may bend if the cartridge is not inserted perpendicularly. · If a SIM card is going to be installed, please go to “Install or Change the SIM card” section of the Kunak AIR Pro User Manual. |
Before placing the base station in the final location, it is recommended to connect the cartridges and probes to test the correct function of the station in the office.
The steps to properly test the device prior to deployment are described below. The device will be factory configured being ready to start working.
|
|
Video tutorial of the steps described below |

|
1 |
Remove the metallic grid cartridge protector by loosening the bolts and sliding the protector forward. |
|
|
2 |
Plug the cartridges of your choice into the device.
|
|
|
3 |
Plug all the probes that will be installed at the final deployment by removing the cover of the connector in which the probe will be mounted. Do not remove covers from connectors that are not going to be used. |
|
|
4 |
Keep the cartridge covers and the connectors protectors of the probes in the cartridges box for future use. |
|
|
5 |
Press the power ON button (the button must be held down) and check on the display that the device detects all the cartridges (on its position) and probes. If any sensor is not detected, verify that it is properly connected. |
|
|
6 |
Mount the metallic grid cartridge protector and tighten the two bolts. Put the device at stand-by or power OFF depending of your needs. |
|


3.9 Location Selection
Selecting a location depends on the final application, road traffic monitoring, urban background, etc. However, the user should have the following considerations when selecting the final location:
|
|
Install the device far away from very close pollution sources and without enough air flow (chimneys, air conditioners, etc), that may disturb your readings. If a sonometer is also going to be placed, install it in a place with low wind impact, avoiding vibration sources and avoiding electromagnetic sources. |
|
|
Install the unit between 3 and 4 meters high. |
|
|
If the unit is installed with solar panel, locate the devices far away from buildings, trees, etc…. to be sure that the solar panel receives maximum solar radiation to guarantee a correct battery recharge. Otherwise, Kunak AIR Pro will run out of battery. |
|
|
if the device is installed with a solar panel in the North hemisphere, the solar panel must face to the South, and to the North in case of the South hemisphere. |


3.10 Installation to Mast or Wall Mount
The Kunak AIR Pro device must be mounted in a determined way due to some design restrictions.
The fixed Kunak AIR Pro model should be mounted with the five cartridge sensor holes facing down and the Kunak AIR Pro sticker facing to the front.
The steps to install the Kunak AIR Pro to a wall or mast are described below. The device is delivered completely mounted into the solar shield.
Different types of possible installations: vertical mast, horizontal mast or wall. The minimum mast diameter on which the device can be hung is 3cm.
|
|
Video tutorial of the steps described below |

|
|
|
|
|
Vertical mast |
Horizontal mast |
Wall |


Figure 7 – Types of possible installations
|
1 |
Place the base of the support on a wall or mast. |
|
|
2 |
Place the support to the base with the two bolts. |
|
|
3 |
Place the device inside the support through the groove. |
|
|
4 |
Screw the two captive fixing bolts. |
|
|
5 |
Connect the power connector and the probes. Screw the probes connectors all the way in.
|
|
|
6 |
Power ON the device returning from “stand-by” by pressing the sleep button or by pressing down the power ON button. |
|


Table 11 – Installation steps
Note: Once
the device is working normally, the status of all sensors, battery, charge and
connection can be checked by pushing the ![]() button.
button.
3.11 Storage and Transportation
There are some aspects to consider if the Kunak AIR Pro device is going to be stored or transported to change of location.
Before uninstalling the device, turn it off.
1.
Push the sleep button ![]() for
5 seconds.
for
5 seconds.
2. LCD will show that is sending the last data.
3. Wait until the LCD and the LEDs are off.
To avoid the stabilization period of the gases sensors, let the device at Stand-by mode. If it is going to be stored long period of time, with the device in stand-by:
4. Un-press the power button (it must rest at the same level that the LCD).
5. Unplug the gas cartridges.
6. Store them at the antistatic bag provided.
7. Plug the cartridge covers to the device.
8. Put the covers on the connectors.
It is very important that the power button is un-pressed before transportation or storage for long period of time. This ensures that the internal battery power is not connected.
3.12 Kunak Cloud Account
When purchasing a Kunak AIR Pro device an email with initial User account and Password of Kunak Cloud (www.kunakcloud.com) is sent. If no user account has been sent, please contact your distributor or KUNAK.
Only an Admin account can create new accounts if free items are available. Check the user manual of Kunak Cloud to get more info.
3.13 Verification of the Correct Functioning
On the Kunak AIR Pro start-up, follow the LCD display info to know that all the sensors are detected by the device and it is correctly connected to the Kunak Cloud. This procedure can last up to 5 minutes.

Figure 8 – LCD display help knowing what has detected the device
Also, it is recommended to wait for the first data to arrive on the Kunak Cloud platform. See the figure below to find the last connection time.

Figure 9 – Last connection time in Kunak Cloud
The device must turn green or yellow (with warnings) indicating that is connected and checking the “last connection time”. It can be read when the last connection was made.
Once the device has successfully connected to the cloud, it sends one measurement to Kunak Cloud before start working at the configured sampling and sending periods. These values can be checked in the dashboard. If the device has been switched off for a long time or the battery has been disconnected, the sensors may require several minutes (between some minutes several hour) till the cartridges reach the working conditions. If the values send by Kunak AIR Pro while the sensors are stabilizing are out of range, the Cloud platform will invalidate these values.
Then, it is recommended to wait a from 2 hours to 24 hours (depending on the sensor) after the first initialization to check the sensor readings. Every Kunak AIR Pro has been factory pre-calibrated before shipping to guarantee the best accuracy as possible during initial deployments. However, a final local calibration may be required to reach the best performance of the sensors.
While Kunak AIR Pro is turned ON and after switching it OFF, the user can access to Kunak Cloud to check the data, connections, health of the devices, sensor readings, etc. Please, check that sensors readings, battery and signal values, charge, etc. are within expected ranges to detect any anomaly.
Kunak AIR Pro must communicate its values to Kunak Cloud, but sometimes a connection may fail. In these cases, the devices will store all the readings till a successful connection is achieved.
If the device status is “OFF” or “OFFLINE” in Kunak Cloud, wait until the next connection period and/or check its last battery value. When the installation has been made under very low signal levels, (<-90dBm), the number of failed connections could be higher than desired, but no data should be lost.
|
|
Be aware when analysing data that each sampling period is an average. It is calculated from the last sample to the new one. The average timestamp is set at the end of the sampling time. If the sampling period is 5 minutes, Kunak AIR device will calculate the average, for example, from 12:08 to 12:13 and the timestamp of that measure will be 12:13.
|

In order to offer the data with the maximum possible reliability, the device has a data discrimination mechanism after a connection to the Kunak Cloud to prevent certain electromagnetic interference (EMI) that can alter the data being sampled at that moment. Once the connection is made, the device will discard the following data in the next 2 to 5 minutes. The range of discarded data, variates depending on the sampling period and the sending period configured. The “Sampling period” and the “Sending period” can be changed through Kunak Cloud. An example of how much time the data is discharged (Guard period) regarding the “Sampling” and “Sending period” is shown below.
|
Sampling period |
Sending period |
Guard period |
|
5 mins |
30 mins |
2 mins |
|
10 seg |
30 mins |
5 mins |
Table 12 – Examples of Guard period regarding the Sampling and Sending period
Therefore, if it is desired to have a very small sampling period of e.g. 1 minute, it is recommended that the sending period is large, at least 1 hour, to minimise the number of data that are lost due to the guard period.
4. OPERATION
4.1 Overall Performance
When a Kunak AIR Pro device is installed in a location and switched on, it starts measuring pollutants in the environment depending on the installed sensors. Each sampling period, the device will save the values of the sensors and store them until the next communication to the Kunak Cloud.
The data is sent through the internet by the 2G/3G/4G telecommunication to our cloud server. Then the data can be analysed by the Kunak Cloud platform, Kunak Watcher android app or by API REST.

Figure 10 – General operation of the devices
4.2 Power On Procedure
Before switching on the device, the user must take into account that:
· All the cartridges and probes are mounted. If they are connected while the device is working, they would not be detected and can damage the sensor and the device.
· To start taking measurements the device has to be installed in a place with enough mobile coverage or internet connection or at least with GPS coverage. In case none of the previous conditions are met please check the warning note at section 4.4 Kunak AIR Pro will not start storing data until it acquires a valid timestamp to tag the datapoints.
The Kunak AIR Pro is factory configured to communicate with the platform directly, no further configuration is required by the user. The cartridge and probes connected to the device are autodetected during initialisation, no configuration is needed.
By pressing the power button, the device
will start working. If the button is pressed, and when pressing the info button
![]() , no information is
shown in the display and no LED blinks, the device is at Stand-by. Please check
the Sleep procedure in section 4.5 Power off Procedure.
, no information is
shown in the display and no LED blinks, the device is at Stand-by. Please check
the Sleep procedure in section 4.5 Power off Procedure.
When the device boots follow these steps:
1. Kunak logo is displayed.
2. If a USB is connected, the initialisation will be blocked waiting for the device configuration program to be finished or for disconnecting the USB.
3. If the device has insufficient battery power, this will be indicated on the display. The device will be set in sleep mode until the battery is sufficiently charged. When the battery is charged, the device will start the process again automatically.
4. All sensors connected to the device are shown on the display. Verify that all cartridges and probes are detected, if not, switch off the device, check the connections and start again.
5. The device will try to connect for the first time to the Kunak Cloud to achieve a valid timestamp and send the settings. The first values from all sensors will also be sent to the Kunak Cloud in order to verify that everything is working correctly.
6. When the first communication is successfully completed, it will be displayed on the screen. If any error occurs, the error will be indicated.
7. If the device fails to connect to the Kunak Cloud it will try to achieve a valid timestamp though GPS or it will check if it has a valid timestamp stored in its non-volatile memory. In case of success the device will start to operate in datalogger mode. In case of failure the device will return to step 5.
8. The first 30 mins after the start-up, the device will connect to the cloud automatically every 5 minutes to send the first data in order to confirm the correct working of the device.
9. After the first 30 mins, the device will start working normally as configured (with the sending period, sampling period and options configured).
|
|
Kunak Cloud will auto-invalidate the first data points after the device starts. To prevent a wrong analysing of the data points of the device pollutants, the cloud auto-invalidate the readings after it start working. The range of invalidated data varies depending on how long the device has been switched off. |
4.3 Measurement mode
The device takes measurements each sampling period and sends the data to the Kunak Cloud each sending period. The sampling and sending period can be changed remotely at Kunak Cloud.
The time (timestamp) at which the device collects or sends data is defined by the time at which the device starts working. For example, if the device starts to operate at 12:03 and is configured to collect and send data every 5 minutes, there will be data at 12:08, 12:13, 12:18, etc. This starting time cannot be changed. Please note that there may be delays due to communication errors.
Sampling
The Kunak AIR Pro will store data from the different sensors at the configured sampling period. When data is saved, the green LED will blink.
|
|
Be aware when analysing data that each sampling period is an average. It is calculated from the last sample to the new one. The average timestamp is set at the end of the sampling time. If the sampling period is 5 minutes, Kunak AIR device will calculate the average, for example, from 12:08 to 12:13 and the timestamp of that measure will be 12:13.
|
In order to offer the data with the maximum possible reliability, the device has a data discrimination mechanism after a connection to the Kunak Cloud to prevent certain electromagnetic interference (EMI) that can alter the data being sampled at that moment. Once the connection is made, the device will discard the following data in the next 2 to 5 minutes. The range of discarded data, variates depending on the sampling period and the sending period configured. The “Sampling period” and the “Sending period” can be changed through Kunak Cloud. An example of how much time the data is discharged (Guard period) regarding the “Sampling” and “Sending period” is shown below.
|
Sampling period |
Sending period |
Guard period |
|
5 mins |
30 mins |
2 mins |
|
10 seg |
30 mins |
5 mins |
Table 13 – Examples of Guard period regarding the Sampling and Sending period
Therefore, if it is desired to have a very small sampling period of e.g. 1 minute, it is recommended that the sending period is large, at least 1 hour, to minimise the number of data that are lost due to the guard period.
Sending data to Kunak Cloud
For each configured sending period, the device will attempt to connect to the Kunak Cloud to send all data stored in the device. If the device fails to transmit the data, the data will be stored until the next sending period or until the memory reaches its maximum by overwriting the first data measured (FIFO).
While the data is sent to the Kunak Cloud, the equipment stops storing samples because of electromagnetic interferences that affect the sensor measurements.
During the whole process of communication with the Kunak Cloud, the green LED will remain on.
The data sending process can take between 1 to 5 minutes depending on the amount of data to be sent.
Information display
While the device is running, the status of
the device and the latest measured values can be watched by pressing the
information button ![]() . By pressing the info
button, all data will be automatically displayed on the screen. When finished,
the display will turn off again.
. By pressing the info
button, all data will be automatically displayed on the screen. When finished,
the display will turn off again.
The display will remain off if the button is not pressed in order to save the device's battery.
4.4 Sleep Mode Procedure
Recovering the device from sleep mode
The Kunak AIR Pro is in sleep mode
if the power button is pressed in, the green LED does not light up and pressing
the info button ![]() does not activate the
display.
does not activate the
display.
To return from sleep, press and hold the
sleep button ![]() until the display
turns on. The display will indicate the processes that the device is going on.
When it has finished to show the messages, it will return to the normal working
state.
until the display
turns on. The display will indicate the processes that the device is going on.
When it has finished to show the messages, it will return to the normal working
state.
Switching the device to sleep mode
It is recommended to switch the device to stand-by in the following cases:
· Before switching off the device completely, so that the last data is sent to the Kunak Cloud.
· When the device is going to be relocated but the gas sensors are powered so they do not have to be stabilised again.
· When the device will be started in a remote location without cellular and GPS coverage (i.e: tunnels, mining facilities) to store a valid timestamp inside the device non volatile memory that will allow it to operate when started later on in a place without cellular and GPS coverage.
To put the device on stand-by, follow the steps below:
1.
Press and hold the sleep button ![]() for 5 seconds.
for 5 seconds.
2. The device will ask to confirm that the user wants it to enter in sleep mode.
3. Confirm or deny by pressing the button below the YES or NO sentences on screen.
4. Once confirmed, the display will show that the equipment is performing the last actions before entering sleep mode. It will take the last sample and send all the data stored so far to the Kunak Cloud.
5. Wait until the sleep process finishes. The display and the LEDs will switch off.
The device will turn off the display and LEDs and will not respond to any keystrokes until the process of returning from stand-by is started.
|
|
Important notice for installations in locations without cellular and GPS coverage. To properly operate and to be able to take measurements Kunak devices need to have a valid timestamp to tag the data points in a timescale. To achieve such timestamp the device tries to connect to Kunak Server and in case of failure it tries to get it through GPS. If a device will be installed in a location where neither of the two options above will succeed, there is a third option available: the device must be started in a location where cellular coverage is available to allow it to get a valid timestamp then once the timestamp has been achieved the device must be put in sleep mode. In sleep mode the timestamp timer is still running. Now the device (still in sleep mode) can be installed in the required location and as last step it MUST be woken up from sleep mode with the proper procedure described above. When waking up from sleep the device will update its valid timestamp and therefore it will be able to start operating in measurement mode even in locations where cellular and GPS coverage are not available. |
4.5 Power off Procedure
The device can be switched off directly from the shutdown button, but the last data will not be sent to the Kunak Cloud platform and the latest valid timestamp will not be stored in device’s non-volatile memory. For all data to be sent to the platform before the device is switched off, the device must be put into stand-by mode (See 4.4 Sleep Mode Procedure).
Once the device is in sleep mode,
press the power off button ![]() and store
the device according to the Storage and Transportation procedure.
and store
the device according to the Storage and Transportation procedure.
4.6 Power Saving
|
|
Only available when the device is equipped with the particulate sensor (OPC). The OPC (Optical Particle Counter) consumes a lot of battery of the Kunak AIR Pro device and therefore the power saving option can be enabled. |
In order to save the device's battery and to keep it on longer, there is a low power mode that can be activated. This mode is mainly intended for devices that are going to be without power for a prolonged period of time, such as devices connected to a solar panel or in places where power cuts are common.
When the device is in this mode, it only affects the particle sensor as it is the element that has the highest power consumption since it has to operate a fan.
To enter this mode, the device must be configured via the Kunak Cloud or the REST API. Through the Kunak Cloud, in the configuration section of the device, there is a section called "Power Saving" for the "Particle sensor" and it must be at "Low power". In brackets can be seen the current status of the device.

Figure 11 – Power saving
· Low power: the device ignores the sampling period for the particulate sensor and starts sampling every 10 minutes. The rest of the sensors are not affected. The particle sensor will be off for 9 minutes, turn on for 1 minute, save the average of samples for that minute, and turn off again. In this mode, the battery life of the device is prolonged. See 2.4 Power Consumption and Duration.
· High power: the particle sensor will work the same as all other sensors and all the restrictions of the “low power” will not apply.
4.7 Clock
The time is provided to the device by several means depending on the available mobile/internet connection and the GPS coverage when it is switched-on. Primarily the device tries to acquire a valid timestamp from Kunak Cloud, if not possible it checks if a valid timestamp has been stored into its non-volatile memory ( as described in section 4.4) and at last it tries to achieve it through GPS The data is always stored in the device with a timestamp in UTC and then the Kunak Cloud corrects the time based on the time zone configured for the device. Therefore, the device will not start taking measurements until the time has been updated at start-up.
The only exception is when the device is a Modbus Slave. In this case measurements will be available on the bus even if the device couldn’t achieve a valid timestamp but timestamp registers will not be meaningful.
In order to keep the timestamp data as accurate as possible, the device time is refreshed once every 7 days.
To better understand how the device operates depending on the mobile available mobile/internet/GPS coverage please check the following state flow.
.

4.8 Sampling period and Timestamp
Then, it is recommended to wait a couple of hours after the first initialisation to check the sensor readings. Every Kunak AIR Pro has been factory pre-calibrated before shipping to guarantee the best accuracy possible during initial deployments. However, a final local calibration may be required to reach the best performance of the sensors.
While Kunak AIR Pro is turned on and after switching it OFF, the user can access to Kunak Cloud to check the data, connections, health of the devices, sensor readings, etc. Please, check that sensor readings, battery and signal values, charge, etc. are within expected ranges to detect any anomaly. In order to know typical ranges, go to 5 SENSORS.
Kunak AIR Pro must communicate its values to Kunak Cloud, but sometimes a connection may fail. In this case, the device will store all the readings till a successful connection is achieved. Then, if the device appears in “red colour” in Kunak Cloud, wait until the next connection period and/or check its last battery value. When the installation has been made under very low signal levels, (<-90dBm), the number of failed connections could be higher than desired, but no data should be lost.
|
|
Be aware when analysing data that each sampling period is an average. It is calculated from the last sample to the new one. The average timestamp is set at the end of the sampling time. If the sampling period is 5 minutes, Kunak AIR device will calculate the average, for example, from 12:08 to 12:13 and the timestamp of that measure will be 12:13.
|

In order to offer the data with the maximum possible reliability, the device has a data discrimination mechanism after a connection to the Kunak Cloud to prevent certain electromagnetic interference (EMI) that can alter the data being sampled at that moment. Once the connection is made, the device will discard the following data in the next 2 to 5 minutes. The range of discarded data, variates depending on the sampling period and the sending period configured. The “Sampling period” and the “Sending period” can be changed through Kunak Cloud. An example of how much time the data is discharged (Guard period) regarding the “Sampling” and “Sending period” is shown below.
|
Sampling period |
Sending period |
Guard period |
|
5 mins |
30 mins |
2 mins |
|
10 seg |
30 mins |
5 mins |
Table 14 – Examples of Guard period regarding the Sampling and Sending period
Therefore, if it is desired to have a very small sampling period of e.g. 1 minute, it is recommended that the sending period is large, at least 1 hour, to minimise the number of data that are lost due to the guard period.
4.9 Auto Geo-position
When Kunak AIR Pro is started, it takes the location via GPS and sends it to the platform. Once the location is sent, it will not send again unless the device is restarted or requested from the Kunak Cloud.
In this way, the location of the device can be identified and displayed on the Kunak Cloud map.
The geo-position could fail if the device is indoors, or if it has been moved to another location without restarting. For these cases, the device can be re-requested to send its position via Kunak Cloud in the "Configuration > Device > Location” section and clicking at the button “Require GPS position".
The device may take a while to geo-position itself while collecting satellite data, be patient.
4.10 Auto Invalidation of data points
In order to avoid the analysis of incorrect data points, in some cases the Kunak Cloud is able to detect such incorrect data and auto-invalidate them. When a data point is invalidated, it is not deleted but the flag is changed from temporary (T) to temporarily invalid (TI).
This is the case, for example, of the initial stabilisation period of the sensors, broken sensor, invalidation of particles due to fog or many other auto-invalidations. The types of flags and the table of automatic invalidations can be found in the Kunak Cloud User Manual.
4.11 Communication by 2G/3G/4G
By default, the device is shipped with a multioperator eSIM (embedded SIM on chip) already installed, configured and ready to operate. At the time of communication, the Kunak AIR Pro device will choose the carrier with the best coverage for the location you are in.
|
|
The eSIM supplied with the device can work in almost all countries. To ensure that it works in your country, please contact your distributor or Kunak. |
In case it is required, the Kunak Air Pro device offers the possibility of inserting an external SIM card. In order to make the device work with the external SIM card it MUST be configured with the new SIM parameters. At any time, the device can be re-installed with the Kunak eSIM by simply removing the external SIM card from its dedicated slot.
4.12 Install or Change the external SIM card
|
|
CAUTION: Inserting a new external SIM into the device or changing the one already inserted in it requires the change of the SIM PIN and APN. · To change the SIM PIN, APN, APN user or APN password, the software “Kunak Device Configurator” MUST be used. The software and the user manual of the “Kunak Device configurator” can be downloaded from the Support area of Kunak Cloud. |

By default, the Kunak AIR Pro is shipped with an eSIM card installed and configured. This is a global multi-operator eSIM card that cannot be removed from the device. With the eSIM, at the time of communication, the Kunak AIR Pro device will choose the carrier with the best coverage for the location you are in.
If it is needed, a Mini-SIM (form factor 2FF, 25mm x 15 mm) card can be installed. In this case, the device must be open to install the mini-SIM and update the PIN and APN configuration of the SIM that has been installed.
The Kunak AIR Pro device will communicate through the eSIM if there is no mini-SIM card inserted. When a mini-SIM card is inserted into the external sim slot, the device will detect it and will always work through the external SIM instead of the embedded eSIM. Therefore, it MUST be ensured that whenever a mini-SIM card is inserted, the device is correctly configured to make the external SIM work.
The following steps describe how to insert an external SIM into a Kunak AIR Pro device.

Figure 12 – Location of the mini-SIM card and USB configurator
|
1 |
The device must be switched off before starting the process. |
|
|
2 |
Remove the solar shield from the device by unscrewing the 2 screws and pulling it out. |
|
|
3 |
Unscrew the 4 screws on the top cover of the device to open the upper half of the device. |
|
|
4 |
Open the SIM card holder by sliding the metal part to the left (as in the picture). |
|
|
5 |
Insert the mini-SIM card by sliding it into the SIM card holder. |
|
|
6 |
When the mini-SIM is inserted, close and look the SIM card holder by sliding the metal part to the right (as in the picture). |
|
|
7 |
Connect the mini-USB cable to the connector and the PC. |
|
|
8 |
Once is connected to the PC, switch on the device. |
|
|
9 |
Wait until “DEVICE READY FOR USB CONFIGURATION” appears on Kunak Air Pro screen. |
|
|
10 |
The device is ready for USB configuration, please follow the instructions bellow to set external SIM configuration parameters to the device through Kunak Device Configurator application. |
|
|
11 |
When the configuration is finished, disconnect the USB, switch off the device and follow the instructions in reverse to reassemble the device. |
|


Table 15 – Install or change of SIM card
To make the external SIM work properly, its PIN and APN parameters MUST be configured and stored into the Kunak AIR device. To do so, Kunak provides a Windows application (Kunak device configurator) that can be downloaded from the Kunak Cloud support section. Once the application has been properly installed, the Kunak AIR device can be connected to the PC through an USB cable in order to be configured by Kunak Device Configurator application.
First, open Kunak Device Configurator application and wait for it to recognize the COM PORT where the device is connected. Once the COM PORT has been displayed in the application window, insert the device PIN to enable Kunak Device Configurator application and click “Next”.

Figure 13 – Device configuration: Detecting devices
Then, Kunak Device Configurator application will show the device’s home page where device name, pin and time zone configuration can be edited if needed. Skip to the SIM and Cellular Communication configuration window by clicking next.

Figure 14 – Device configuration: node
In case your external SIM requires a PIN in order to enable communication, configure it in the “SIM PIN” field, otherwise leave the field as it is.

Figure 15 – Device configuration: PIN
Once in the SIM and Cellular Communication window, set your specific external SIM configuration parameters in the “SIM APN”, “APN user” and “APN password” fields.
![]() Search for the APN configuration of your operator over internet.
Search for the APN configuration of your operator over internet.

Figure 16 – Device configuration: Connection
Once all external SIM parameters have been properly configured, by clicking “Next”, the Kunak Device Configurator will launch a Communication Test where the device will try to connect to Kunak Cloud server to verify that cellular communication works properly. This test may take up a few minutes to complete. If the SIM has been properly configured the test will succeed and the device is ready to operate, otherwise please check the error code displayed by Kunak Device Configurator and go back to the SIM configuration window to check the external SIM configuration.

Figure 17 – Device configuration: node status
To store the configurations into Kunak Air Pro device and start normal operation, please skip through the Kunak Device Configurator windows by clicking “Next” until you reach the end.
4.13 Local USB configuration
The device can be configured remotely at any time via Kunak Cloud. If necessary, it can be configured via USB and a Windows application (Kunak device configurator) that can be downloaded from the Kunak Cloud support section.
It is needed a mini-USB cable to connect the device to the PC.
|
1 |
The device must be switched off before starting the process. |
|
|
2 |
Remove the solar shield from the device by unscrewing the 2 screws and pulling it out. |
|
|
3 |
Unscrew the 4 screws on the top cover of the device to open the upper half of the device. |
|
|
4 |
Connect the mini-USB cable to the connector and the PC |
|
|
5 |
Switch on the device and follow the instructions of the “device configurator manual”. |
|
|
6 |
When the configuration is finished, disconnect the USB, switch off the device and follow the instructions in reverse to reassemble the device. |
|


Table 16 – USB configuration procedure
4.14 Kunak Cloud
The Kunak AIR Pro device has been designed to work with a powerful cloud platform Kunak Cloud. Remote configurations, calibration, analytics, etc... can be done from this powerful software. Please, download the “Kunak Cloud WEB” manual to explore all the software capabilities from the “support” section in your Kunak Cloud account (up-right).

Figure 18 – Kunak Cloud support section
5. SENSORS
The Kunak AIR Pro device takes measures continuously of each sensor. The mean value of each sampling period (configured in Kunak Cloud) is stored. The frequency of the measures variates depending on the sensors:
|
Sensor |
Frequency |
Seconds |
|
Internal sensors |
Sampling period configured |
Sampling period configured |
|
Environmental sensors |
Sampling period configured |
Sampling period configured |
|
Gases |
3 Hz |
0.2 s |
|
Particles |
0.3 Hz |
3 s |
|
Noise |
8 Hz |
0.125 s |
Table 17 – Frequency of the sensors
Those samples can be accessed through Kunak Cloud platform, Kunak Watcher mobile application or integrated into other systems via the REST API. Please refer to Kunak Cloud User Manual or the Kunak API User Manual for instructions on how to proceed.
|
|
Be aware when analysing data that each sampling period is an average. It is calculated from the last sample to the new one. The average timestamp is set at the end of the sampling time. If the sampling period is 5 minutes, Kunak AIR device will calculate the average, for example, from 12:08 to 12:13 and the timestamp of that measure will be 12:13.
|

In order to offer the data with the maximum possible reliability, the device has a data discrimination mechanism after a connection to the Kunak Cloud to prevent certain electromagnetic interference (EMI) that can alter the data being sampled at that moment. Once the connection is made, the device will discard the following data in the next 2 to 5 minutes. The range of discarded data, variates depending on the sampling period and the sending period configured. The “Sampling period” and the “Sending period” can be changed through Kunak Cloud. An example of how much time the data is discharged (Guard period) regarding the “Sampling” and “Sending period” is shown below.
|
Sampling period |
Sending period |
Guard period |
|
5 mins |
30 mins |
2 mins |
|
10 seg |
30 mins |
5 mins |
Table 18 – Examples of Guard period regarding the Sampling and Sending period
Therefore, if it is desired to have a very small sampling period of e.g. 1 minute, it is recommended that the sending period is large, at least 1 hour, to minimise the number of data that are lost due to the guard period.
5.1 Internal Sensors
All the internal sensors will be always supplied with a Kunak AIR Pro device.
5.1.1 Device status sensors
All Kunak devices come with built in sensors to monitor internal device status. Those sensors are:
|
Sensor |
Description |
|
Battery (%) |
Device battery percentage. |
|
Charge (V) |
Voltage provided by the charger. |
|
I_Charge (mA) |
Current provided by the charger. Only available at devices with operation package. |
|
Signal (dBm) |
Mobile coverage of the device |
|
Temp |
Internal temperature of the equipment. Only available at devices with operation package. |
Table 19 – Device status sensors
The Battery sensor gives measures of the battery voltage. With rechargeable batteries, those measures should range between 4.1 volts (100%) when fully charged and 3.4 V (1%) when nearly empty. At 3.4 V (1%), the device will automatically switch off to protect the battery life, but the sensors will rest powered to prevent its destabilization. Kunak AIR Pro will automatically switch on when 3.45 V (11%) is reached.
The Charge sensor informs whether an external power supply is connected to the device either for continuous operation or recharge the battery. It shows the Voltage of the power source, for example, the power supply or a solar panel. The behaviour of each one can be seen below.

Figure 19 – Normal behaviour of a power supply charge

Figure 20 – Normal behaviour of a solar panel charge
At the Figure 20 – Normal behaviour of a solar panel charge is shown:
1. Night period.
2. Day period.
3. Charging the battery. Depending on the amount of sun, the power of the solar panel cannot be enough to charge the battery.
4. Not charging the battery. It can be because the battery is full or because it has not enough sun to charge the battery.
|
|
The Kunak Cloud will inform the user that the device is getting out of battery. Automatically, the platform detects when a device is not powered or the battery is almost discharged and informs the user by generating an alarm (pink status colour). |
The Signal sensor gives measures of the 2G/3G/4G service signal strength in dBm. Signal communications should work within an approximate range from -50 (very good coverage) to -115 dBm (low coverage).
The Temp sensor gives measures of the internal temperature of the device with 0.5ºC resolution. This temperature usually increases when the device is charging the battery.
5.1.2 Environmental Data
Kunak AIR Pro device is a total solution that includes a continuous monitoring system of ambient temperature, relative humidity, dew point and atmospheric pressure.
These sensors are always supplied with the Kunak AIR Pro device and they are needed for advanced algorithms to achieve the highest accuracy, mitigating the effects of temperature, humidity and cross-sensitivities.
The technical data of environmental sensors are explained in the tables below.
|
Parameter |
Type |
Unit |
Measurement Range[6] |
Resolution[7] |
Operating Temperature Range[8] |
Operating RH Range[9] |
|
Temp ext |
Solid state |
ºC |
-40 - 125ºC |
0.01ºC |
-40 - 125ºC |
0 - 100 %RH |
|
Humidity ext |
Solid state |
% |
0 - 100 %RH |
0.04% |
-40 - 150ºC |
0 - 100 %RH |
|
Pressure |
Solid state |
hPa |
300 - 1100 hPa |
0.18 Pa |
-90 to 85ºC |
0 - 100 %RH |
|
Dew Point |
Solid state |
ºC |
-40 - 125ºC |
0.01ºC |
-40 - 125ºC |
0 - 100 %RH |
Table 20 – Technical Characteristics Internal Environmental sensors
|
Parameter |
Typical Accuracy[10] |
Typical 90% confidence interval[11] |
R² Typical precision[12] |
|
Temperature |
± 0.9ºC |
1.5 ºC |
> 0.95 |
|
Relative humidity |
± 3 %RH |
6 %RH |
> 0.95 |
|
Pressure |
± 2 hPa |
3 hpa |
> 0.95 |
Table 21 – Proven performance on field Internal Environmental sensor
5.1.3 GNSS position
The actual position of the Kunak AIR Pro is measured with the build in GNSS sensor that gets the position from GPS, GLONASS receivers.
|
PROPERTY |
DESCRIPTION / VALUE |
|
Type |
GPS, GLONASS |
|
Accuracy |
2.5 meters |
|
Cold Start Time |
35 seconds |
|
Hot Start time |
1 second |
|
Tracking Sensitivity |
-159 dBm |
Table 22 – GPS position characteristics
The GNSS can work in two different ways depending on the application: fixed or mobile. The working mode of the sensor can be changed any time is needed from the Kunak Cloud.
In both cases, each time the Kunak AIR Pro is power on, it gets the GNSS position but if it is configured as a fixed device, it will not take any sample of the position until the next powering off or resetting of the device.
Only if the Kunak AIR Pro is configured to take samples in continuous of the GNSS, the device will take a sample each sampling period and send all the GNSS parameters to the Kunak Cloud. The parameters that will be measured are described in Table 23 – Parameters of GNSS position sensor.
|
PARAMETERS |
UNITS |
DESCRIPTION |
|
GNSS Lat |
deg |
Latitude |
|
GNSS Lon |
deg |
Longitude |
|
GNSS Alt |
m |
Altitude |
|
GNSS Speed |
km/h |
Speed of the device |
|
GNSS Sats |
Sats |
Number of satellites used for the position fix |
|
GNSS HDOP |
|
Horizontal dilution of precision of the position sample |
Table 23 – Parameters of GNSS position sensor in continuous mode
5.2 Smart Cartridge Sensors
5.2.1 Cartridge Overview
We have developed an innovative system of cartridges that integrate the different sensors of the main environmental pollutants. The Kunak AIR Pro can carry up to five cartridges that can be easy & fast replaced or combined with others when necessary (no need to unhook the equipment).
This innovative system makes possible to replace the sensors in a plug & play manner, which means that it is not necessary to dismantle the equipment or send it to the technical service, reducing the time of replacement of the sensors and the time in which the device is not collecting data.
All the cartridges have the same size and fit in any of the five available sockets. Inside the cartridge, we install the sensor into a PCB that stores its all information: type, age and factory calibration. When you plug the new cartridge, the base station just reads the information, configures itself, and starts working.
The cartridges can be connected according to your needs and modify the parameters to be measured over time by simply changing the cartridge. The equipment will auto-configure itself to the connected cartridges and will load its calibrations to work with maximum precision. All the information stored on each cartridge and the calibrations performed will be saved in the cloud to guarantee traceability.

Table 24 – Cartridge sensors slots
|
|
The VOCs sensor cartridge ionises ambient air generating small amounts of O3, so avoid installing it near O3, NO2 or SO2 sensors. For example, place the VOCs sensor in slot 5 and the O3, NO2 and SO2 sensors in slots 1, 2 and 4; avoid placing them in slot 3. |
The equipment includes an automatic cartridge detection system, regardless of the slot to which it is connected. Its advanced LCD display informs about the correct installation and start of the operation of the new installed cartridge.
All cartridges are validated and calibrated in the laboratory against traceable reference standards and include an individualized behaviour algorithm for the sensor (specific curve for each cartridge). Intelligent algorithms that compensate for environmental conditions and the ageing of the sensor element.
|
PROPERTY |
DESCRIPTION / VALUE |
|
Dimensions |
35.5 mm x ⌀57 mm |
|
Weight |
~50 gr |
Table 25 – Cartridge characteristics

Figure 21 – Cartridge overview
The gas sensors are shown in the device and in the Kunak Cloud with their names. In the table below shows how it will be changing the “XX” depending on the name of the gas.
|
Parameter |
Unit measure |
Description |
|
XX GC |
µg/m3, ppb |
Gas Concentration. Shows concentration as it comes from the sensors, including negative values. Only available at devices with operation package. |
|
XX GCc |
µg/m3, ppb |
Gas Concentration Corrected. Shows the corrected concentration, filtering negative values |
|
XX GCc AVG1H |
µg/m3, ppb |
Average 1-hour Gas Concentration Corrected. Only available at devices with analytic package. |
|
XX GCc AVG8H |
µg/m3, ppb |
Average 8-hour Gas Concentration Corrected. Only available at devices with analytic package. |
|
XX GCc AVG24H |
µg/m3, ppb |
Average 24-hour Gas Concentration Corrected. Only available at devices with analytic package. |
Table 26 – Gas sensor names
5.2.2 Multiple Repeated Cartridges
The Kunak AIR Pro is capable of reading multiple cartridges of the same pollutant. In this way, several cartridges can be tested, calibrated, etc. at the same location to compare their performance. This option is available from device firmware version 1.255.3 onwards.
In order to be able to identify each cartridge of the same pollutant in the Kunak Cloud, the tag of each cartridge changes slightly. When there is no repeat pollutant cartridge connected to the device, the tag for each gas is as described in section 5.2.1 Cartridge Overview. But in the case of repeated pollutants, the number of the slot in which it is located is added to the tag from the first detected repeated cartridge.
In the following table you can find an example where in the same device there are 5 cartridges connected, 1 of type “XX” and 4 of type “YY”.
|
Position |
Pollutant Tag |
|
Catridge 1 |
XX GCc |
|
Catridge 2 |
YY GCc |
|
Catridge 3 |
YY GCc_3 |
|
Catridge 4 |
YY GCc_4 |
|
Catridge 5 |
YY GCc_5 |
Table 27 – Example of multiple cartridges of the same pollutant connected to the same device
5.2.3 Stabilization Period
When a Kunak AIR is deployed for the first time in a place, the gas sensors must stabilize. This stabilization variates depending on how much the device was without power, but it is between 1 hour and 5 days.
In order to keep the gas stabilisation period as short as possible when changing the location of the device, it is advisable to leave the equipment on stand-by.
The Kunak AIR gas sensors are very sensitive to abrupt changes in temperature and humidity. For example, a change of more than a 10% RH in less than an hour, may affect some sensors causing invalid measures, above all, the NO2.
5.2.4 Quality Control and Quality Assurance cycle

Table 28 – Quality Control and Quality Assurance cycle
1. Sensors are factory assessed to ensure the good operation of each sensor.
2. Each cartridge with its individual electronics is characterized under specific environmental conditions.
3. (Laboratory) Kunak Calibration against reference standards.
4. Validation of the laboratory calibration against Kunak Gold standards correctly maintained with reference AQMS. Kunak algorithm uses the reference data for validation, not for calibration, to guarantee the best available accuracy.
5. Kunak Cloud allows the devices' remote management and configuration, as well as their data analysis. A calibration tool is available to re-adjust the cartridges remotely. Cartridges can be sent back individually to Kunak for a laboratory re-calibration if required.
6. Once the sensor arrives at its end of life, cartridges are returned to Kunak and the electronics are recycled for new cartridges.
Onboard algorithm
Kunak AIR uses onboard sensors and Kunak embedded algorithm that calculates the concentrations in ppb or μg/m3 locally and in real-time, not using or needing external reference data to calculate gas or particle concentrations.
Kunak algorithm corrects the interferences and artifacts typically found in raw data compensating environmental effects like temperature, humidity and pressure (depending on the cartridge) as well as cross-sensitivities using onboard data.
Benefits
· Calibrate the cartridge for any condition.
· Real-time compensation of temperature effects.
· Traceable QC&QA.
· Not dependant on nearby stations.
5.2.5 Cartridge Specifications
|
Parameter |
Type |
Unit |
Measurement Range[13] |
Resolution[14] |
|
|
K-CO-A-01 |
Carbon Monoxide (CO) |
Electrochemical |
µg/m3, ppb |
0-12,000 ppb |
1 ppb |
|
K-CO-B-01 |
Carbon Monoxide (CO) |
Electrochemical |
mg/m3, ppm |
0-500 ppm |
0.01 ppm |
|
K-CO2-A-01 |
Carbon Dioxide (CO2) |
Non-dispersive Infrared (NDIR) |
mg/m3, ppm |
0-5,000 ppm |
1 ppm |
|
K-NO-A-01 |
Nitric Oxide (NO) |
Electrochemical |
µg/m3, ppb |
0-5,000 ppb |
1 ppb |
|
K-NO2-A-01 |
Nitrogen Dioxide (NO2) |
Electrochemical |
µg/m3, ppb |
0-5,000 ppb |
1 ppb |
|
|
NOx |
Electrochemical |
µg/m3, ppb |
0-10,000 ppb |
1 ppb |
|
K-O3-A-01 |
Ozone (O3) |
Electrochemical |
µg/m3, ppb |
0-2,000 ppb |
1 ppb |
|
K-H2S-A-01 |
Hydrogen Sulfide (H2S) |
Electrochemical |
µg/m3, ppb |
0-2,000 ppb |
1 ppb |
|
K-H2S-B-01 |
Hydrogen Sulfide (H2S) |
Electrochemical |
mg/m3, ppm |
0-20 ppm |
0.01 ppm |
|
K-SO2-A-01 |
Sulfur Dioxide (SO2) |
Electrochemical |
µg/m3, ppb |
0-10,000 ppb |
1 ppb |
|
K-NH3-A-01 |
Ammonia (NH3) |
Electrochemical |
mg/m3, ppm |
0-50 ppm |
0.01 ppm |
|
K-VOCs-A-01 |
Volatile Organic Compounds (VOCs) |
Photoionization |
µg/m3, ppb |
0-3,000 ppb |
1 ppb |
|
K-VOCs-B-01 |
Volatile Organic Compounds (VOCs) |
Photoionization |
mg/m3, ppm |
0-40 ppm |
0.01 ppm |
Table 29 – Cartridge technical characteristics (part1)
|
Type |
Parameter |
Optimal Operating Temp. Range[15] |
Optimal Operating RH Range[16] |
Operating life[17] |
Guarantee Range[18] |
|
K-CO-A-01 |
Carbon Monoxide (CO) |
-30 to 50 ºC |
15 to 90% RH |
> 24 months |
1,000 ppm |
|
K-CO-B-01 |
Carbon Monoxide (CO) |
-30 to 50 ºC |
15 to 90% RH |
> 24 months |
1,000 ppm |
|
K-CO2-A-01 |
Carbon Dioxide (CO2) |
0 to 50 ºC |
0 to 95% RH |
> 7 years |
- |
|
K-NO-A-01 |
Nitric Oxide (NO) |
-30 to 40 ºC |
15 to 85% RH |
> 24 months |
20 ppm |
|
K-NO2-A-01 |
Nitrogen Dioxide (NO2) |
-30 to 40 ºC |
15 to 85% RH |
> 24 months[19] |
20 ppm |
|
|
NOx |
-30 to 40 ºC |
15 to 85% RH |
> 24 months |
70 ppm |
|
K-O3-A-01 |
Ozone (O3) |
-30 to 40 ºC |
15 to 85% RH |
> 24 months[20] |
20 ppm |
|
K-H2S-A-01 |
Hydrogen Sulfide (H2S) |
-30 to 50 ºC |
15 to 85% RH |
> 24 months |
100 ppm |
|
K-H2S-B-01 |
Hydrogen Sulfide (H2S) |
-30 to 50 ºC |
15 to 85% RH |
> 24 months |
100 ppm |
|
K-SO2-A-01 |
Sulfur Dioxide (SO2) |
-30 to 40 ºC |
15 to 85% RH |
> 24 months |
100 ppm |
|
K-NH3-A-01 |
Ammonia (NH3) |
-10 to 50 ºC |
15 to 85% RH |
> 24 months |
100 ppm |
|
K-VOCs-A-01 |
Volatile Organic Compounds (VOCs) |
-40 to 60 ºC |
0 to 99% RH |
10,000 hours |
50 ppm |
|
K-VOCs-B-01 |
Volatile Organic Compounds (VOCs) |
-40 to 60 ºC |
0 to 99% RH |
10,000 hours |
60 ppm |
Table 30 – Cartridge technical characteristics (part2)
|
Proven performance on laboratory |
Proven performance on field |
|||||
|
Parameter |
LOD [21] |
Response Time[22] |
Limit level[23] |
Typical Accuracy[24] |
Typical 90% confidence interval[25] |
R² Typical precision[26] |
|
Carbon Monoxide (CO, type A) |
10 ppb |
< 30 s |
< 50 ppb |
±0.08 ppm |
0.125 ppm |
> 0.85 |
|
Carbon Monoxide (CO, type B) |
20 ppb |
< 180 s |
< 50 ppb |
±0.08 ppm |
0.15 ppm |
> 0.85 |
|
Carbon Dioxide (CO2) |
<20 ppm |
< 30 s |
- |
±30 ppm |
- |
- |
|
Nitric Oxide (NO) |
2 ppb |
< 30 s |
< 5 ppb |
±4 ppb |
10 ppb |
> 0.9 |
|
Nitrogen Dioxide (NO2) |
2 ppb |
< 60 s |
< 10 ppb |
±5 ppb |
10 ppb |
> 0.85 |
|
NOx |
2 ppb |
< 60 s |
< 10 ppb |
±6 ppb |
12 ppb |
> 0.9 |
|
Ozone (O3) |
2 ppb |
< 70 s |
< 10 ppb |
±8 ppb |
14 ppb |
> 0.9 |
|
Hydrogen Sulfide (H2S, type A) |
4 ppb |
< 60 s |
< 10 ppb |
±10 ppb |
20 ppb |
> 0.75 |
|
Hydrogen Sulfide (H2S, type B) |
0.01 ppm |
< 60 s |
- |
±0.05 ppm |
- |
> 0.75 |
|
Sulfur Dioxide (SO2) |
5 ppb |
< 60 s |
< 20 ppb |
±15 ppb |
25 ppb |
> 0.7 |
|
Ammonia (NH3) |
< 0.1 ppm |
< 45 s |
< 0.5 ppm |
±0.3 ppm |
- |
- |
|
Volatile Organic Compounds (VOCs, type A) |
1 ppb |
< 12 s |
< 12 ppb |
±10 ppb[27] |
- |
> 0.99 |
|
Volatile Organic Compounds (VOCs, type B) |
0.01 ppm |
< 10 s |
< 0.2 ppm |
±0.1 ppm |
- |
> 0.99 |
Table 31 – Performance of cartridge sensors
Some gases have cross-sensitivity to other gasses. For the best performance, some sensors must be supplied to correct this cross-sensitivity as shown in Table 5 – Gas automatic correction.
|
Gas automatic correction |
|
|
Carbon Monoxide (CO) |
Temperature |
|
Carbon Dioxide (CO2) |
Temperature |
|
Nitric Oxide (NO) |
Temperature |
|
Nitrogen Dioxide (NO2) |
Temperature |
|
NOx |
NO & NO2 |
|
Ozone (O3) |
Temperature, NO2 |
|
Hydrogen Sulfide (H2S) |
Temperature |
|
Sulfur Dioxide (SO2) |
Temperature, CO, NO2 & O3 |
|
Ammonia (NH3) |
Temperature, H2S |
|
Volatile Organic Compounds (VOCs) |
Temperature, humidity, pressure |
Table 32 – Gas automatic correction if in they are in the same device
The cross-sensitivity for each gas is shown below with more information particular to each sensor.
5.2.5.1 Carbon Monoxide (CO)

Figure 22 – CO cartridge
The Carbon Monoxide Cartridge has a built-in electrochemical sensor with very low noise electronics allowing the measurement from very low concentrations (ppb) up to several ppm. To cover different applications, there are two measurement ranges: Type A measuring the most common range, and Type B, a higher range version that can measure up to 500 ppm, decreasing the accuracy at low concentrations.
This cartridge is very stable over time with a lifespan that can go beyond the specification for several months under no extreme environments.
There are 2 types of CO cartridge depending on the measurement range required:
|
Part number |
Range |
Kunak Cloud Tag |
|
K-CO-A-01 |
0 to 12 ppm |
CO GCc |
|
K-CO-B-01 |
0 to 500 ppm |
CO_B GCc |
|
Cross sensitivity to other gasses |
||||
|
Filter capacity |
|
ppm ∙ hrs |
|
250,000 |
|
H2S |
sensitivity % measured gas @ |
5 ppm |
H2S |
< 1 |
|
NO2 |
sensitivity % measured gas @ |
5 ppm |
NO2 |
< 1 |
|
Cl2 |
sensitivity % measured gas @ |
5 ppm |
Cl2 |
< 1 |
|
NO |
sensitivity % measured gas @ |
5 ppm |
NO |
< -3 |
|
SO2 |
sensitivity % measured gas @ |
5 ppm |
SO2 |
< 0.1 |
|
H2 |
sensitivity % measured gas @ |
100 ppm |
H2 |
< 50 |
|
C2H4 |
sensitivity % measured gas @ |
100 ppm |
C2H4 |
< 1 |
|
NH3 |
sensitivity % measured gas @ |
20 ppm |
NH3 |
< 0.1 |
Table 33 – Cross sensitivity of CO
5.2.5.2 Carbon Dioxide (CO2)

Figure 23 – CO2 cartridge
The Carbon Dioxide Cartridge has a built-in non-dispersive infrared sensor (NDIR) ideal to measure from low to high concentrations that can be found in the atmosphere. Besides, it includes an automatic baseline calibration to maintain the long-term stability with now effect of humidity, temperature and pressure, which are corrected in the algorithm.
As it is a Non-dispersive Infrared (NDIR) sensor it has no cross-sensitivity to other gases.
|
Part number |
Kunak Cloud Tag |
|
K-CO2-A-01 |
CO2 GCc |
CO2 cartridge has not any cross-sensitivity with any other ambient gases.
5.2.5.2.1 Auto-calibration Carbon Dioxide (CO2) cartridge
The CO2 cartridge has a built-in auto-calibration function. It must be exposed to typical background levels at least once during the auto-calibration period. The auto-calibration function uses the information gathered during these periods to reset the zero value of the CO2 cartridge.
The sensor will reset the ‘zero’ level every time it does an auto-calibration. Auto-calibration is enabled by default, with a minimum background ambient level of 390 ppm. This value can be changed by the user if desired.
Every time the Kunak AIR is switched on or reset from “stand-by” mode, the auto-calibration will be ON and a first auto-calibration will be performed in the first 24 hours. Once the first auto-calibration is done, the auto-calibration period is set every 7 days. Thus, an auto-calibration will be performed every 7 days, after the first 24 h auto-calibration.
The auto-calibration function is available in “Configuration” > “Simple”, in the “Sensor” section. Select the device with a CO2 cartridge, and the sensor “CO2”. It is possible to power ON and OFF the CO2 auto-calibration and set the minimum background level.

Figure 24 – CO2 auto-calibration function
5.2.5.3 Nitric Oxide (NO)

Figure 25 – NO cartridge
The Nitric Oxide Cartridge has a built-in electrochemical sensor ideal to measure from very low ppb concentrations up to several ppm than can be found in the atmosphere close to pollution sources (vehicles, industries…). This cartridge is very accurate and stable with a very good temperature correction algorithm and can work beyond two years easily under no extreme environments.
The cartridge can suffer from a small zero drift (some ppbs) over time that can be easily corrected with the remote Kunak Calibration Tool available on Kunak Cloud Software.
|
Part number |
Kunak Cloud Tag |
|
K-NO-A-01 |
NO GCc |
|
Cross sensitivity to other gasses |
||||
|
H2S |
sensitivity % measured gas @ |
5 ppm |
H2S |
< 10 |
|
NO2 |
sensitivity % measured gas @ |
5 ppm |
NO2 |
< 4 |
|
Cl2 |
sensitivity % measured gas @ |
5 ppm |
Cl2 |
< 3 |
|
SO2 |
sensitivity % measured gas @ |
5 ppm |
SO2 |
< 5 |
|
H2 |
sensitivity % measured gas @ |
100 ppm |
H2 |
< 0.1 |
|
CO |
sensitivity % measured gas @ |
5 ppm |
CO |
< 0.3 |
|
NH3 |
sensitivity % measured gas @ |
5 ppm |
NH3 |
< 0.1 |
|
CO2 |
sensitivity % measured gas @ |
5% Vol |
CO2 |
< 0.1 |
|
O3 |
sensitivity % measured gas @ |
100 ppb |
O3 |
< 4 |
|
Halothane |
sensitivity % measured gas @ |
100 ppm |
Halothane |
< 0.1 |
Table 34 – Cross sensitivity of NO
5.2.5.4 Nitrogen Dioxide (NO2)

Figure 26 – NO2 cartridge
The Nitrogen Dioxide Cartridge has a built-in electrochemical sensor that has no interference with Ozone thanks to its embedded O3 filter, making the cartridge ideal to measure the concentrations found in the atmosphere, from very low levels in clean environments to high concentrations in polluted areas of cities or industries.
However, the cartridge can be affected by fast humidity transients reducing its accuracy during these events.
|
Part number |
Kunak Cloud Tag |
|
K-NO2-A-01 |
NO2 GCc |
|
Cross sensitivity to other gasses |
||||
|
O3 |
Filter capacity (ppm ∙ hr) |
0.5 ppm |
O3 |
> 500 |
|
H2S |
sensitivity % measured gas @ |
5 ppm |
H2S |
< -80 |
|
NO |
sensitivity % measured gas @ |
5 ppm |
NO |
< 5 |
|
Cl2 |
sensitivity % measured gas @ |
5 ppm |
Cl2 |
< 100 |
|
SO2 |
sensitivity % measured gas @ |
5 ppm |
SO2 |
< -3 |
|
CO |
sensitivity % measured gas @ |
5 ppm |
CO |
< -3 |
|
H2 |
sensitivity % measured gas @ |
100 ppm |
H2 |
< 0.1 |
|
C2H4 |
sensitivity % measured gas @ |
100 ppm |
C2H4 |
< 0.1 |
|
NH3 |
sensitivity % measured gas @ |
20 ppm |
NH3 |
< 0.1 |
|
CO2 |
sensitivity % measured gas @ |
5% Vol |
CO2 |
< 0.1 |
|
Halothane |
sensitivity % measured gas @ |
100 ppm |
Halothane |
nd |
Table 35 – Cross sensitivity of NO2
5.2.5.5 Ozone (O3)

Figure 27 – O3 cartridge
The Ozone Cartridge has a built-in electrochemical sensor that detects NO2 and O3 concentrations. Then, to measure accurately the O3 concentration, it is required to have installed in the same device the NO2 Cartridge. Thus, thanks to Kunak algorithm, it is possible to deliver accurate measurements of Ozone, with no NO2 influence, even at high temperatures which are related to higher O3 concentration due to the sun radiation.
|
Part number |
Kunak Cloud Tag |
|
K-O3-A-01 |
O3 GCc |
|
Cross sensitivity to other gasses |
||||
|
H2S |
sensitivity % measured gas @ |
5 ppm |
H2S |
< -80 |
|
NO |
sensitivity % measured gas @ |
5 ppm |
NO |
< 5 |
|
Cl2 |
sensitivity % measured gas @ |
5 ppm |
Cl2 |
< 100 |
|
SO2 |
sensitivity % measured gas @ |
5 ppm |
SO2 |
< -3 |
|
CO |
sensitivity % measured gas @ |
5 ppm |
CO |
< -3 |
|
C2H4 |
sensitivity % measured gas @ |
100 ppm |
C2H4 |
< 0.1 |
|
NH3 |
sensitivity % measured gas @ |
20 ppm |
NH3 |
< 0.1 |
|
H2 |
sensitivity % measured gas @ |
100 ppm |
H2 |
< 0.1 |
|
CO2 |
sensitivity % measured gas @ |
5% Vol |
CO2 |
< 0.1 |
|
Halothane |
sensitivity % measured gas @ |
100 ppm |
Halothane |
< 0.1 |
Table 36 - Cross sensitivity of O3
The O3 cross-sensitivity with NO2 is automatically corrected by the Kunak AIR device if both sensors are installed at the same device.
5.2.5.6 Hydrogen Sulfide (H2S)

Figure 28 – H2S cartridge
The Hydrogen Sulfide Cartridge has a built-in electrochemical sensor very sensitive to its specific pollutant allowing the sensor to detect any change in H2S concentration and detect low ppb concentrations in real environments.
Additionally, this cartridge responds and detects Methyl Mercaptan (CH4S).
To cover different applications, there are 2 measurement ranges:
· Type A: detect low ppb concentrations in real environments. Although Kunak algorithm corrects well the temperature variations, it is not recommended to use this cartridge to detect levels below 10 ppb.
· Type B: a higher range version that can measure up to 20 ppm, decreasing the accuracy at low concentrations.
|
Part number |
Range |
Kunak Cloud Tag |
|
K-H2S-A-01 |
0-2,000 ppb |
H2S GCc |
|
K-H2S-B-01 |
0-20 ppm |
H2S_B GCc |
|
Cross sensitivity to other gasses |
||||
|
NO2 |
sensitivity % measured gas @ |
5 ppm |
NO2 |
< -10 |
|
Cl2 |
sensitivity % measured gas @ |
5 ppm |
Cl2 |
< -12 |
|
NO |
sensitivity % measured gas @ |
5 ppm |
NO |
< 12 |
|
SO2 |
sensitivity % measured gas @ |
5 ppm |
SO2 |
< 20 |
|
CO |
sensitivity % measured gas @ |
5 ppm |
CO |
< 3 |
|
H2 |
sensitivity % measured gas @ |
100 ppm |
H2 |
< 0.5 |
|
C2H4 |
sensitivity % measured gas @ |
100 ppm |
C2H4 |
< 0.1 |
|
NH3 |
sensitivity % measured gas @ |
20 ppm |
NH3 |
< 0.1 |
|
CO2 |
sensitivity % measured gas @ |
5% |
CO2 |
< 0.1 |
|
CH4S |
sensitivity % measured gas @ |
0.32 ppm |
CH4S |
< 30 |
Table 37 – Cross sensitivity of H2S
5.2.5.7 Sulfur Dioxide (SO2)

Figure 29 – SO2 cartridge
The Sulfur Dioxide Cartridge has a built-in electrochemical sensor that presents high cross-sensitivities with O3 and NO2. When used together with the NO2 and O3 cartridges, the Kunak algorithm is capable of correcting from these cross-sensitivities improving the accuracy of the measurements. However, it is not recommended for outdoors applications requiring accurate SO2 measurements at very low concentrations (<20ppb).
|
Part number |
Kunak Cloud Tag |
|
K-SO2-A-01 |
SO2 GCc |
|
Cross sensitivity to other gasses |
||||
|
Filter capacity |
|
ppm ∙ hrs |
|
450 |
|
H2S |
sensitivity % measured gas @ |
5 ppm |
H2S |
< 2 |
|
NO2 |
sensitivity % measured gas @ |
5 ppm |
NO2 |
< -120 |
|
Cl2 |
sensitivity % measured gas @ |
5 ppm |
Cl2 |
< -80 |
|
NO |
sensitivity % measured gas @ |
5 ppm |
NO |
< 4 |
|
CO |
sensitivity % measured gas @ |
5 ppm |
CO |
< 3 |
|
H2 |
sensitivity % measured gas @ |
100 ppm |
H2 |
< 0.5 |
|
C2H4 |
sensitivity % measured gas @ |
100 ppm |
C2H4 |
< 1 |
|
NH3 |
sensitivity % measured gas @ |
20 ppm |
NH3 |
< 0.1 |
|
CO2 |
sensitivity % measured gas @ |
5 % |
CO2 |
< 0.1 |
|
O3 |
sensitivity % measured gas @ |
0.5 ppm |
O3 |
< -120 |
Table 38 – Cross sensitivity of SO2
The SO2 cross-sensitivity with NO2 and O3 is automatically corrected by the Kunak AIR device if the tree sensors are installed at the same device.
5.2.5.8 Ammonia (NH3)

Figure 30 – NH3 cartridge
The Ammonia Cartridge has a built-in electrochemical sensor capable of measuring from low to high concentrations with a typical noise below 0.3 ppm when the ambient temperature is under 25ºC. The Cartridge presents cross-sensitivities with NO2, O3, Cl2 and SO2 that can be negligible in most applications. However, it also presents cross-sensitivity to H2S, which is quite relevant because they can co-exist and both measurements can be essential for the same purpose. That is why, it is recommended to use it together with the H2S cartridge, which allows the Kunak algorithm to correct from this cross-sensitivity.
|
Part number |
Kunak Cloud Tag |
|
K-NH3-A-01 |
NH3 GCc |
|
Cross sensitivity to other gasses |
||
|
Interfering Gas |
Concentration [ppm] |
Reading [ppm] |
|
Cl2 |
20 |
-55 |
|
CO |
300 |
0 |
|
CO2 |
20000 |
0 |
|
H2 |
200 |
0 |
|
H2S |
20 |
7 |
|
NO |
20 |
-1 |
|
NO2 |
20 |
-20 |
|
SO2 |
20 |
-7 |
Table 39 - Cross sensitivity of NH3
5.2.5.9 Volatile Organic Compounds (VOCs)

Figure 31 – VOCs cartridge
|
|
The VOCs sensor cartridge ionises ambient air generating small amounts of O3, so avoid installing it near O3, NO2 or SO2 sensors. For example, place the VOCs sensor in slot 5 and the O3, NO2 and SO2 sensors in slots 1, 2 and 4; avoid placing them in slot 3. |
The Volatile Organic Compounds Cartridge has a built-in photoionization (PID) sensor provided with a 10.6 eV light energy source to measure accurately the 100s of VOCs commonly found in indoor and outdoor environments. Its cutting-edge design avoids any undesirable humidity effect, giving 10,000 hours continuous operation, and, together with temperature and pressure correction algorithm, allows accurate measurements.
|
Part number |
Range |
Kunak Cloud Tag |
|
K-VOCs-A-01 |
0 to 3000 ppb |
VOCs GCc |
|
K-VOCs-B-01 |
0 to 40 ppm |
VOCs_B GCc |
Photoionization Detectors (PIDs) respond to a broad range of Volatile Organic Compounds (VOCs). For a PID sensor to respond to a specific VOC, the photon energy of the lamp must be greater than its ionization energy (IE). The PID sensor is provided with a 10.6 eV lamp.
The table https://www.kunak.es/doc/08.Manuals/Kunak_Cartridge_VOCs_Response_Factor.pdf shows a list of the response factors (‘RF’s’) for the different volatiles detected by PID 10.6 eV sensor. The RF relates the sensitivity of PID to a specific VOC to the sensitivity to the standard calibration gas, isobutylene. The higher the RF, the lower the sensitivity.
Ideally, the PID response to a specific VOC would be calibrated by using a low concentration of that VOC in air. However, this is often not practical. Isobutylene is used to calibrate the PID sensor, and a Response Factor (RF) used to convert the isobutylene calibrated measurement to a measurement of the target VOC:
Concentration of target VOC = isobutylene calibrated measurement x RF
As an example, the RF of acetone is 1.17 with a 10.6 eV lamp. That means 1.17 ppm of acetone delivers the same PID response as 1 ppm isobutylene. A 10 ppm response to acetone, from a isobutylene-calibrated unit would indicate:
Concentration of acetone = 10 ppm x 1.17 = 11.7 ppm
5.3 Optical Particle Counter Sensor
Some Kunak AIR Pro models integrate an Optical Particle Counter capable of measuring particles from 0.3 μm up to 40 μm. Then, the PM1, PM2.5, PM4, PM10, Total Suspended Particles (TSP) and Total Particle Counter (TPC) are calculated assuming a particle density profile. Field co-location studies have shown that the expected field performance is comparable to Palas Fidas 200 equivalent instrument.
Therefore, the user has six different OPC sensors available in the Kunak Cloud platform: PM1, PM2.5, PM4, PM10, TSP and TPC respectively.
This sensor works with the same principle of operation as conventional optical particle counters, i.e. by measuring the light scattered by individual particles carried in a sample air stream through a laser beam. These measurements are used to determine the particle size and particle number concentration. Particle mass loadings (PM1, PM2.5, PM4 and PM10) are then calculated from the particle size spectra and concentration data.
The OPC-N3 calculates the respective PM values according to the method defined by European Standard EN 481. The EN 481 standard definition for PM10 extends to particle sizes beyond the upper measurable size limit of the OPC-N3. In some cases, this can result in the reported PM10 value being underestimated by up to ~10%.
The OPC-N3 calculations of particle mass assume a negligible contribution from particles below approximately 0.35 µm, the lower limit of particle detection of the OPC-N3 sensor.
|
Parameter |
Type |
Unit measure |
Measurement Range[28] |
Resolution[29] |
Operating |
Operating |
Operating life[32] |
|
PM1 |
Optical |
µg/m³ |
0 - 1,000 µg/m³ |
1 µg/m³ |
-10 to |
0 to |
> 24 months |
|
PM2.5 |
µg/m³ |
0 – 2,000 µg/m³ |
1 µg/m³ |
> 24 months |
|||
|
PM4 |
µg/m³ |
0 – 2,000 µg/m³ |
1 µg/m³ |
> 24 months |
|||
|
PM10 |
µg/m³ |
0 - 10,000 µg/m³ |
1 µg/m³ |
> 24 months |
|||
|
TSP |
µg/m³ |
0 - 15,000 µg/m³ |
1 µg/m³ |
> 24 months |
|||
|
TPC |
counts/cm³ |
0 – 8,000 counts/cm³ |
1 counts/cm³ |
> 24 months |
Table 40 – OPC Technical characteristics
|
Proven performance on laboratory |
Proven performance on field |
|||
|
Parameter |
LOD [33] |
Typical Accuracy[34] |
Typical 90% confidence interval[35] |
R² Typical precision[36] |
|
PM1 |
0.5 µg/m³ |
± 2 µg/m³ |
3 µg/m³ |
> 0.9 |
|
PM2.5 |
0.5 µg/m³ |
± 3 µg/m³ |
4 µg/m³ |
> 0.8 |
|
PM4 |
0.5 µg/m³ |
± 3 µg/m³ |
4 µg/m³ |
> 0.8 |
|
PM10 |
1 µg/m³ |
± 4 µg/m³ |
7 µg/m³ |
> 0.7 |
|
TSP |
1 µg/m³ |
± 6 µg/m³ |
10 µg/m³ |
> 0.7 |
|
TPC |
- |
- |
- |
> 0.8 |
Table 41 – OPC proven performance on field
The effect of humidity is perfectly corrected with the embedded algorithm achieving high accuracy at any environmental conditions except under foggy days or condensation, where the data is automatically invalidated by the software Kunak Cloud. Further calibrations can be applied at a specific site to match the mass concentrations. Also, the particle size distributions are available on Kunak Cloud
|
Parameter |
Unit measure |
Description |
|
PMxx |
µg/m3 |
Particle measure of 1, 2.5 or 10 µm |
|
PMxx AVG1H |
µg/m3 |
Average 1-hour particle |
|
PMxx AVG24H |
µg/m3 |
Average 24-hour particle |
|
TSP |
µg/m3 |
Total Suspended Particles |
|
TSP AVG1H |
µg/m3 |
Total Suspended Particles average 1-hour |
|
TSP AVG24H |
µg/m3 |
Total Suspended Particles average 24-hour |
|
TPC |
counts/cm³ |
Total Particle Counter |
|
TPC AVG 1H |
counts/cm³ |
Total Particle Counter average 1-hour |
|
PM_SFR |
ml/s |
Sample flow rate of the particle sensor |
Table 42 – OPC sensor names
5.3.1 Particle flow rate (SFR)
|
|
This parameter is only visible for devices purchased with Operational Package. To ensure that it works in your country, please contact your distributor or Kunak. |
The particles are counted in a sample air stream through the internal OPC-N3 sensor. The Sample Flow Rate (SFR) is monitored in Kunak Cloud with the name “PM_SFR” in (ml/s). It can be a good indicator to see if the OPC is working properly or if the inlet is stuck.
The range between the “PM_SFR” must be work correctly is from 2 ml/s to 6 ml/s, but it can be greater.
An operation Alarm will be generated when it considers that the inlet of the particle sensor is stuck. When this happens, is highly recommended to clean the device as mentioned in the section of maintenance.
If the “PM_SFR” is still low (less than 1.7 ml/s) after having cleaned the OPC and reboot the device, it is a sign that the OPC sensor must be replaced.
6. EXTERNAL OPTIONAL SENSORS
There are 5 plugs at the bottom of the Kunak AIR Pro device to connect the power and extra sensors. Each M12 plug is different and only fits its specific connector.
The probes or extra sensors can be plugged to the Kunak AIR Pro device in every moment and some of them depends on the characteristics chosen at the purchase time. The probes will be automatically detected at start-up of the device. The features of each connector are:
· Connector 1 (M12 x 4 pins type T): Power 7V to 12V.
· Connector 2 (M12 x 4 pins type D):
o K-A3-xx-3: Ethernet PoE.
o K-A3-xx-4: Modbus Slave.
· Connector 3 (M12 x 5 pins type B): Sound Level Meter.
· Connector 4 (M12 x 8 pins type A): Modbus Master & (WBGT or Pyranometer).
· Connector 5 (M12 x 5 pins type A): Anemometer & Rain Gauge.
Figure 32 – Probes position
6.1 Sound Level Meter LAeq
In case Noise monitoring is also required, a sound meter can be installed with the Kunak device. Install it in a place with low wind impact, avoiding vibration sources and electromagnetic sources.
The sound meter take samples each second and the measure in Kunak Cloud is the logarithmic average from the Sound meter samples.
Table 43 – Sound meter Characteristics |
Figure 33 – Sound meter |

Installation:
|
1 |
Place the solar shield support on a wall or mast. |
|
|
2 |
Place the solar shield inside the support through the groove. |
|
|
3 |
Connect one end of the cable to the sonometer (do not forget tightening the connector’s security nut). Plug the other end of the cable into the Kunak device (do not forget tightening the connector’s security nut). |
|


Figure 34 – Installation of a sound meter
6.2 Mechanical Anemometer
The Kunak device obtains the average wind speed (“W Speed AVG”), max wind speed (“W Speed MAX”) and the average wind vane (“W Vane AVG”) at the sampling period configured.
|
Parameter |
Unit measure |
Description |
|
W Speed AVG |
Km/h |
Average Wind Speed |
|
W Speed MAX |
Km/h |
Max Wind Speed |
|
W Vane AVG |
deg |
Average wind Direction |
Table 44 – Anemometer parameters
It includes both wind speed and wind direction sensors. Rugged components stand up to hurricane‐force winds yet are sensitive to a light breeze. It includes sealed bearings for long life. In areas where icing formation, there are some limitations when using the mechanical anemometer due to drip deflects water to the joint between moving parts.
Table 45 – Characteristics mechanical anemometer |
Figure 35 – Mechanical anemometer |

Installation:
|
1 |
Install the Vane and the Cups of the anemometer. Use the Allen key provided to tighten the set screw on the side of the wind cups and the one of the vanes. |
|
|
2 |
Insert the anemometer arm through the notch base and attach the screw through the holes. |
|
|
3 |
Install the sensor on a pole. The arm of the anemometer must be oriented to the North to adjust the 0 degrees. |
|
|
4 |
Align your sensor with the tool supplied. Turn the sensor until is correctly oriented to the North as in the picture. |
|
|
5 |
Connect to the anemometer to the Kunak device. At the Quick Start Guide is specified the plugging. |
|


Table 46 – Mechanical anemometer installation
6.3 Ultrasonic Anemometer
The Kunak device obtains the average wind speed (“W Speed AVG”), max wind speed (“W Speed MAX”) and the average wind vane (“W Vane AVG”) at the sampling period configured.
|
Parameter |
Unit measure |
Description |
|
W Speed AVG |
Km/h |
Average Wind Speed |
|
W Speed MAX |
Km/h |
Max Wind Speed |
|
W Vane AVG |
deg |
Average wind Direction |
Table 47 – Anemometer parameters
Includes both wind speed and wind direction sensors. It is an ultrasonic self-powered anemometer. The power requirement is small.
Table 48 – Characteristics ultrasonic anemometer |
Figure 36 – Ultrasonic anemometer |

Installation:
|
1 |
Mount the sensor on a pole or a vertical surface. |
|
|
2 |
Clip the tool on the tube and slide it so that it snaps into the dedicated slots as in the picture. Do not tamper with the slots. The tool must gently find its place. |
|
|
3 |
With the black tool correctly placed on the anemometer, align the tool (and the sensor) to North. |
|
|
4 |
Connect to the anemometer to the Kunak device. At the Quick Start Guide is specified the plugging. |
|


Table 49 – Ultrasonic anemometer installation
6.4 Rain Gauge
The rain gauge is highly reliable, simple to maintain and simple to clean, useful for all environmental conditions. Proven self-emptying bucket technology to ensure uninterrupted measurement of precipitation regardless of amount and intensity.
It measures rain using a standardized orifice funnel that collects water into a self-emptying bucket mechanism. This mechanism offers more consistent long-term response than tipping-bucket rain gauges because its counterweight is not affected by water, dirt and dust accumulation.
|
|
When installing the rain gauge, make sure that the bubble is in the centre of the level to ensure correct data. |
Table 50 – Characteristics Rain Gauge |
Figure 37 – Rain Gauge |

Bird protection spikes with leaf/debris fence prevent birds from nesting in the rain gauge funnel and reduce large debris accumulation like leaves. The overall effect is reduced maintenance and longer service intervals plus increased measurement reliability and consistency.

Figure 38 – Rain gauge bird protection
6.5 WBGT
Wet Bulb Globe Temperature Sensor (WBGT) measures the thermal radiation in the range of -30 up to +75°C.
|
Parameter |
Unit measure |
Description |
|
WBGT |
C |
Thermal radiation |
|
T_Globe |
ºC |
Temperature of the globe (devices with operation package only) |
Table 51 – WBGT parameters
Table 52 – Characteristics WBGT |
Figure 39 – WBGT |

Supplied with a support base.
7. POWER OPTIONS
Kunak provides different ways of power the Kunak AIR Pro unit depending on the application where is going to be installed the device. The allowed voltage to recharge the device ranges between 7 and 12 volts (12W min recommended) for external chargers and 6 volts (12W) for solar panels.
Kunak AIR Pro is supplied with an internal rechargeable lithium battery to prevent losses of power supply. In this way, it can continue measuring for long periods of power loss, until the power supply is restored.
In order to supply the device, either to charge the internal battery or to power the device, the options are:
· Indoor charger: For test or connect the device inside a building.
· Outdoor charger: IP67 to support the outside conditions.
· Solar panel: For the cases that there are no plugs available to connect the charger.
![]() The battery charging will stop if the temperature reaches 60ºC.
The battery charging will stop if the temperature reaches 60ºC.
The power source in all cases (power supply or solar panel) must be connected in the plug number 1. See the image below:
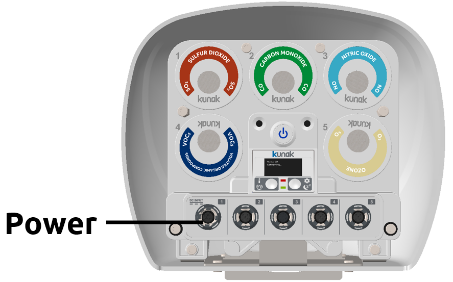
Figure 40 – Power connector
If necessary, the diagram of the pins connections of the 4 pins M12 type T is shown below. The power voltages must be connected to the pins:
· 1: VDD
· 4: GND

Figure 41 – Charger plug diagram
7.1 High power battery
When needed, the internal battery can be changed by a high-power battery to increase the duration of the device when is not plugged into the power supply for a large period or when is connected to a solar panel.
Table 53 – High power battery specifications |
Figure 42 – High power battery |

7.2 Indoor Charger
The indoor power supply has global power grid plugs to fit most power outlets.
![]() To protect the system while working with the indoor charger, it is
recommended to plug it after a 1A 220V circuit breaker.
To protect the system while working with the indoor charger, it is
recommended to plug it after a 1A 220V circuit breaker.
Table 54 – Power supply specifications |
Figure 43 – Global power supply |

7.3 Outdoor Charger
If the device is going to be installed aboard, you must use a charger that can withstand these conditions.
![]() To protect the system while working with the outdoor charger, it is
recommended to plug it after a 1A 220V circuit breaker.
To protect the system while working with the outdoor charger, it is
recommended to plug it after a 1A 220V circuit breaker.
Table 55 – Power supply specifications |
Figure 44 – Outdoor Charger |

The charger is supplied with a 2 metres cable that connects the charger to the equipment.
Depending on the precise requirements of the installation, the connection between the charger and the power grid must be made by the installer. It must connect the power grid to the internal terminals of the charger.
|
|
NOTE: The cable to connect it to the power grid is not supplied. |
|
1 |
Install the outdoor charger at its final position. |
|
|
2 |
Open the cover and thread the cable through the cable gland. |
|
|
3 |
Connect the wires to the terminals. |
|
|
4 |
Close the cover of the outdoor charger and connect the supplied cable to the device. |
|


Table 56 – Outdoor Charger installation
7.4 Solar Panel 12W
Considerations of the installation for maximum performance of the solar panel:
- Orientation: should be oriented in the proper direction to be exposed to the highest intensity of sunlight for the longest period of time to ensure proper recharging of the battery. It is recommended to orient the solar panel towards the South in the Northern hemisphere or towards the North in the Southern hemisphere as shown in the picture below.

Figure 45 – Orientation of the solar panel
· Tilt: the angle the panel makes with respect to the horizontal ground. The solar panel can be adjusted with a simple mechanism between 0º to 90º. The angle depending on the location is given below.

Figure 46 – Panel tilt depending on location
The solar panel is a 12 watt, 6 volts, orientable and waterproof designed for prolonged outdoor use in any environment. The size is of the solar panel is 340 x 220 mm. It is provided with 1.5 meters length cable to connect it to the device.
Table 57 – Solar panel specifications |
Figure 47 – Solar panel |

Required Tools:
· 5-mm Allen Key
· 10 mm spanner.
· (For mast installation) Screwdriver or 7 mm socket wrench.
· (For mast installation) Cutter for the stainless-steel hose clamp.
· (For wall installation) Screwdriver and 4 screws (minimum 2).
Installation over big mast (more than 5 cm diameter)
|
1 |
Cut the metal strap band to the required size. Check that is correctly oriented (see Figure 45). Once the metal part is in place, the floor sticker should be visible as shown in the picture. |
|
|
2 |
Install de solar panel with the first screw |
|
|
3 |
Screw the second bolt at the tilt of the location (see Figure 46) |
|


Table 58 – Solar panel installation over big mast
Installation over small mast (less than 5 cm diameter)
|
1 |
Cut the metal strap band to the required size. Check that is correctly oriented (see Figure 45). Once the metal part is in place, the floor sticker should be visible as shown in the picture. |
|
|
2 |
Install de solar panel with the first screw |
|
|
3 |
Screw the second bolt at the tilt of the location (see Figure 46) |
|


Table 59 – Solar panel installation over small mast
Installation over wall
|
1 |
Cut the metal strap band to the required size. Check that is correctly oriented (see Figure 45). Once the metal part is in place, the floor sticker should be visible as shown in the picture. |
|
|
2 |
Install de solar panel with the first screw |
|
|
3 |
Screw the second bolt at the tilt of the location (see Figure 46) |
|


Table 60 – Solar panel installation over wall
8. MAINTENANCE
8.1 Schedule
Kunak understands the importance of collecting the highest quality data. Our devices have been designed to ensure their optimum operation during an extended period.
Our sensors offer a long service life between 12-36 months, depending on the sensor. Their service is degraded by the natural loss of the optical and electrochemical capabilities and can be adjusted with the calibration tool over the operating life.
The sensors are very sensitive and to ensure the maximum performance of the devices, it is mandatory to follow the maintenances activities shown in Table 1 – Maintenance of the device.
|
ACTIVITY |
Before Install |
Every 4-6 |
12 months |
24 months |
WHO |
|
Baseline calibration (zero) |
∆ |
∆ |
X |
X |
Authorized agent |
|
Span Calibration |
|
∆ |
X |
X |
Authorized agent |
|
Check and cleaning OPC (In locations with high concentration of particles) |
|
X |
X |
X |
Authorized agent |
|
Check and cleaning OPC |
|
X |
X |
Authorized agent |
|
|
Replacement of PM sensor |
|
|
|
∆ |
Authorized agent |
|
Replacement of CO sensor |
|
|
|
X |
Technician |
|
Replacement of CO2 sensor |
7 years |
Technician |
|||
|
Replacement of NO sensor |
|
|
|
X |
Technician |
|
Replacement of NO2 sensor |
|
|
∆ |
X |
Technician |
|
Replacement of O3 sensor |
|
|
∆ |
X |
Technician |
|
Replacement of H2S sensor |
|
|
|
X |
Technician |
|
Replacement of SO2 sensor |
|
|
|
X |
Technician |
|
Replacement of NH3 sensor |
|
|
|
X |
Technician |
|
Replacement of VOCs sensor |
|
|
∆ |
X |
Technician |
Table 61 – Maintenance of the device
- X Mandatory
- ∆ Just required for optimal performance
Depending on the consumption of the device, the battery reaches its end of useful life, after certain number of charge cycles, the user can request a change of battery directly to Kunak. The typical duration of the battery is more than 5 years.
8.2 Cartridge Replacement
The gas sensors have a limited time of correct operation specified.
|
1 |
Kunak AIR Pro device must be powered OFF. If the device is powered ON while doing the change, it can damage the sensor or the Kunak AIR Pro station. |
|
|
2 |
Unplug and plug the gas cartridge at any of the slots.
|
|
|
3 |
Keep the cartridge covers and the connectors protectors of the probes in the cartridge box for future use. |
|
|
4 |
Power ON the Kunak AIR Pro device and see at the LCD if the new cartridge has been correctly detected. |
|


Table 62 – Change of a gas cartridge
8.3 Particle sensor Replacement
When is needed to change the particle sensor, follow the following steps.
|
1 |
Kunak AIR Pro device must be powered OFF. If the device is powered ON while doing the change, it can damage the sensor or the Kunak AIR Pro station. |
|
|
2 |
Change the particle sensor following the one of the 2 possible ways: · Kunak AIR Pro OPC cartridge cover replacement: https://youtu.be/BUWRI3SjoFc · Kunak AIR Pro OPC cartridge replacement: https://youtu.be/p8IKfrrHCx8 |
|
|
3 |
Power ON the Kunak AIR Pro device and see at the LCD if the new cartridge has been correctly detected. |
|

Table 63 – Change of the particle sensor
8.4 Particle sensor Cleaning
Sometimes it is needed to clean the OPC (Optical Particle Counter) sensor, for example, for maintenance or when the sensor is stuck.
· External inspection: externally check that nothing is obstructing the air inlet of the device. If yes, remove the obstruction.
· Internal inspection and cleaning: With the device turned off:
|
1 |
Remove the solar shield from the device by unscrewing the 2 screws and pulling it out. |
|
|
2 |
Clean the filter of the inlet and the outlet of the Kunak AIR Pro. |
|


Table 64 – Internal cleaning of the Particle sensor
8.5 Firmware Update
8.5.1 FOTA
The Kunak AIR Pro devices support FOTA (Firmware Over The Air) update. Contact Kunak to know the latest firmware version available for your device.
8.5.2 USB Firmware Update
The device can be updated remotely but, if necessary, it can be updated via USB and a Windows application (Kunak Firmware Uploader) that can be downloaded from the Kunak Cloud support section.
It is needed a mini-USB cable to connect the device to the PC.
|
1 |
The device must be switched off before starting the process. |
|
|
2 |
Remove the solar shield from the device by unscrewing the 2 screws and pulling it out. |
|
|
3 |
Unscrew the 4 screws on the top cover of the device to open the upper half of the device. |
|
|
4 |
Connect the mini-USB cable to the connector and the PC. |
|
|
5 |
Press FW button (close to the USB connector) and hold it. |
|
|
6 |
Switch on the device. |
|
|
7 |
Wait around 10 seconds then release FW button. |
|
|
8 |
The device is ready for Firmware Upload. |
|
|
9 |
When the upload is finished, disconnect the USB, switch off the device and follow the instructions in reverse to reassemble the device. |
|


Table 65 – USB configuration procedure
8.6 Factory Reset
It is possible to reset the device by pressing the “FW” button (inside of the device) for at least 5 seconds, until the LEDs flash turn red. Once the device has been reset, its factory parameters will be applied to the device.
9. GAS AND PARTICLE CALIBRATION
Below, it is explained how to make a correct gas and particle calibration of the Kunak Air device. The calibration consists of adjusting the sensor's parameters based on the relation between the concentration value entered by the user and the concentration measured by the sensor itself. Values entered by the user should come from valid sources like official air quality stations or reference certified instrument.
To facilitate the Kunak Air device calibration, based on the reference value entered by the user, two tools are provided in “Operation” tab > “Gas & Particle Calibration” in the KunakCloud section.
9.1 Gas calibration
Kunak Air device integrates electrochemical sensors to measure gas pollutants. It is possible to calibrate the gas sensors by the “Baseline and Span calibration” in the “Gas Calibration” tool that can be found in “Operation” tab > “Gas & Particle Calibration” in the KunakCloud section.
o Baseline: it adjusts the sensor's zero conditions, the sensor measurements for null or minimum gas concentrations.
o Span: it increases or reduces the measurement range by adjusting the sensor's sensitivity.
In order to ensure the reliability of the Kunak Air sensor readings, the performance of the sensors should be periodically checked or calibrated. The calibration periodicity depends on the sensor properties, environmental conditions and the user/application requirement for the accuracy and reliability of the readings.
To perform the sensor calibration, there are a few options for the user.
- Outdoor calibration
- With reference station: co-location of the devices at an official reference station.
- With GOLD device: In the “golden sample” approach a compact sensor recently and properly evaluated at a reference station is circulated at sensor sites for comparison of readings.
- Without reference: only the baseline of the sensors can be calibrated.
- Laboratory calibration
|
|
NOTE: A factory calibration is always carried out by Kunak to assure the quality and performance of every Kunak Air device. At least, every unit has been working continuously for 5 days, calibrated and compared to a reference unit before shipping |
9.1.1 Outdoor calibration
Please, note that every Kunak Air has been laboratory calibrated and the calibration has been validated before shipping at the outdoor environmental conditions before the shipping. Any big change in the environmental conditions (+/-10°C average temperature) may slightly affect factory calibration settings.
9.1.1.1 With reference station
Place the Kunak Air device near an official reference station to carry out a colocation test. For the most accurate calibration, place the Kunak Air at a maximum distance of 2 meters from the inlet port of the reference air quality station.
Once Kunak Air has been installed, wait for at least 24h for stabilization before comparing any data between Kunak Air and the reference station. Then, if required, calibrate Kunak Air as shown in sections 9.1.3 and 9.1.4.
After calibration, keep on the device working for several hours or days to compare the data with the reference station to guarantee a correct performance, as specified in the datasheet and/or shown in the field tests that can be found in the “Support” section of the KunakCloud web.
Once the calibration has been validated, switch off the unit. Now, Kunak Air is ready to be deployed anywhere. If required, Kunak can integrate[37] into KunakCloud platform any third-party data (for example, air quality reference stations data) to make easier the calibration process.
9.1.1.2 With GOLD device
Place the GOLD device near the Kunak Air device to be calibrated. For the most accurate calibration, place the Kunak Air and the GOLD device at a maximum distance of 1 meter between them.
Once they have been installed, wait for at least 24h for stabilization before comparing any data between Kunak Air and the GOLD device. Then, if required, calibrate the Kunak Air as shown in sections 9.1.3 and 9.1.4.
After calibration, keep on the device working for several hours or days to compare the data with the GOLD device to guarantee a correct performance as specified in the datasheet and/or shown in the field tests that can be found at the “Support” section of the KunakCloud web.
Once the calibration has been validated, switch off the GOLD unit. Now, the GOLD device can be moved to another location to calibrate another device.
9.1.1.3 Without reference
If there is no access to any reference data, a rough “calibration/adjustment” can be done in the baseline of the sensors.
In this case, it is not called calibration, but adjustment of the baseline because it is not used any reference data to carry out this correction in the cartridges.
In this case, please contact Kunak for further and specific assistance. Mainly, gases will usually reach a minimum concentration during a certain part of the day. For example, it is possible to find concentrations that vary, depending on the type of gas, from zero ppb to a few ppb at night time. The user must find these periods to perform a correct baseline adjustment or correct negative night values as a zero. We encourage our customers to contact Kunak if they want to carry out this type of calibration.
If calibration is carried out with the correct parameters, Kunak Air is expected to have the same correlation (R²) and accuracy values as the ones specified in the datasheets.
If the user is looking for the maximum accuracy, a new baseline calibration is required if the average temperature changes 10 degrees from the average temperature during calibration.
9.1.2 Laboratory calibration
9.1.2.1 Initial Set Up
It is advisable to use one of the settings described below to ensure the quality of the laboratory tests.
- Sealed enclosure: Composed of a sealed enclosure with a controlled input and output. In the middle of the enclosure must be positioned the DUT (Device Under Test) Kunak Air. Below the sensor surface, a sample probe must be connected to reference equipment to guarantee the real concentration around the sensor area. The maximum distance from the surface of the sensor and the input of the reference equipment must be lower than 5 cm.

Figure 48 – Sealed enclosure
- Gas-Hood: Design a gas hood that fits under Kunak Air with an input and output port. The gas hood is required to enclose the gas sensors and the humidity/temperature sensor. The temperature and humidity sensor is important to the Kunak Air device because the gas sensors are affected by these parameters and the device corrects the measurements obtained by using the temperature and humidity values. It must be taken into account any possible reaction that can be produced by the contact of the gas and the tool, so inert materials are mandatory for any gas hood designs.
|
|
NOTE: It must be considered that it can be losses of gas through the humidity and temperature sensor as well as any loss within the material's surface. Kunak strongly recommend the customer to always take the output of the tool into reference equipment to know the real concentration on the sensor surface |

Figure 49 – Gas Hood
The temperature, humidity and pressure conditions for the tests should be set like the ones that the device will have in its final location. If these data are unknown, the recommended conditions are the ones described in Table 1 – Temperature, humidity and pressure condition for the test.
|
Parameter |
Operating Range |
Recommended Testing Values |
|
Temperature |
-30 ⁰C to 40 ⁰C |
20 ⁰C |
|
Humidity |
15 %Rh to 85 %Rh |
50 %Rh |
|
Pressure |
80 KPa to 120 KPa |
101.325 KPa |
Table 66 – Temperature, humidity and pressure condition for the test
|
|
CAUTION! Temperature and humidity affect the sensors. High changes in temperature or humidity affect the gas sensors readings:
|

9.1.2.2 Calibration procedure
Initial considerations before starting the calibration procedure:

Figure 50 – Change of the device sampling period
o Configure the sending period taking into account that the equipment will stop measuring from 1 minute to 5 minutes maximum (depending on sampling period and sending period), after sending the values to the KunakCloud, to avoid electromagnetic interference in the gas sensors. Electromagnetic interferences of cellular communications can affect the sensor readings. It is recommended to configure the sending period to 10-15 min to carry out these tests. To change the sending period remotely go, on the KunakCloud website, to “Configuration > Simple > Device”. Select the device to modify the sending period and modify it in “Communications > Sending period” and click on “Save” button to send it to the device. In the next sending period of the device, will be changed.

Figure 51 – Change of the sending period
o It is not recommended to use dry air (see Table 66 – Temperature, humidity and pressure condition for the test) for the calibration process. Please, note that the whole calibration process should be carried out with similar humidity conditions for a long time.
Two calibrations must be done to guarantee the correct performance of the Kunak Air:
o Baseline: This procedure sets the zero value of the sensors. It must always be done before the Span Calibration.
1. Introduce zero air to the DUT and check that the humidity has not changed dramatically. If there is a big change in the humidity conditions, continue in this step for 4 hours.
2. Check the concentration values with the reference equipment.
3. Wait 8 hours, for sensors stabilization and check that no humidity transients are presented during this time. Also, check that the sensor readings are stable during the last 2 hours.
4. Calibrate the sensor baseline using the KunakCloud web Calibration Tool.
5. After calibration, wait 1 hour and confirm that the sensor value is zero. If not, repeat the previous step.
|
|
NOTE: The sensors accuracy at zero concentration is expected to be around ±5 ppb for NO, NO2, O3, H2S and SO2 and ±20 ppb for the CO if the steps have been correctly followed and no humidity transients are present during the calibration procedure |
o Span: This procedure adjusts the sensitivity of the sensor.
1. Introduce a constant concentration of the desired gas. Recommended concentrations are between 100 ppb and 400 ppb for NO, NO2, O3, H2S, SO2; between 1ppm to 8ppm for CO Type A and 2ppm to 50 ppm for CO Type B; and between 1 ppm and 10 ppm for VOCs. In the last case, an Isobutylene gas bottle is recommended for span calibration. It must be taken into account all the impurities that can be introduced in the enclosure, especially with the O3 and NOX sensors.
2. Check the concentration of the gas with the reference equipment. Always use the reference equipment readings for the Span calibration set point.
3. Wait 1 hour for the sensor to stabilize.
4. Calibrate the sensor using the KunakCloud web Calibration Tool.
5. After calibration, wait 1 hour to confirm that the concentration is the same as the reference equipment.
|
|
NOTE: The baseline calibration must be done before the span calibration |
9.1.2.3 Validation tests
Every Kunak Air has passed the “Kunak quality system assurance” before shipping. However, if any kind of test might be done at a reference laboratory, we recommend carrying out the tests below with the setup described in section 9.1.2.
· Test A: Introduce different gas concentrations and compare the results with the reference equipment. The typical concentration setpoints are shown in Figure 5 – Test of gas concentration. In the case of CO Type A, it is recommended to do steps from 1 ppm to 8 ppm, and for CO Type B, steps from 2 ppm to 50 ppm.
In the case of VOCs cartridge, an Isobutylene gas bottle must be used. In this case, it is recommended to do steps: 10 ppm, 5 ppm, 1 ppm and 0.5 ppm.

Figure 52 – Test of gas concentration
· Test B: With a constant concentration of one of the gases, change the temperature and the humidity and compare it with the reference equipment. Recommended to make progressive changes and not exceed ±5 °C per hour and ±10% RH per hour.
Considerations:
· A stabilization of 4 hours will be required if abrupt changes in temperature or humidity occur.
· The equipment recalculates the concentration of the gas depending on the temperature and humidity values. That is why the sensors of humidity and temperature must be in contact with the measured gas.
9.1.3 Baseline calibration
This calibration consists of finding a period, or bringing the sensor, under a minimum reference gas concentration, ideally zero gas concentration of the targeted gas, and modifying the calibration parameters under this condition.
|
|
NOTE: Please take into account that this calibration mustn't work correctly if it is applied to other values than the minimum gas concentrations, since it modifies the zero conditions of the sensors. |
Gases will usually hit a minimum concentration during a certain part of the day. For example, it is possible to find concentrations that vary, depending on the type of gas, from 0 ppb to a few ppb at night time. The user must find these periods to perform a correct baseline calibration.
Follow the steps below to perform a correct baseline calibration through the KunakCloud web.
9.1.3.1 Calibration Type, Devices and Gas
The very first step in a calibration process is selecting the device(s) and gas to calibrate. It is possible to calibrate multiple devices at the same time by selecting them in the dropdown list or writing its tag. Note that only one gas can be calibrated at a time. To go to the next step, click on the “Next” button.

Figure 53 – Baseline calibration: select device & gas
9.1.3.2 Reference value and Period
Select the period in which the gas concentration has reached the reference value. In Figure 7 – Baseline calibration: calibration period selection, it is selected a reference value of 0 ppb starting at 1:00 am of January 21st 2021 for 2 hours.

Figure 54 – Baseline calibration: calibration period selection
9.1.3.3 Check data
In this step, you must select the period to be charted so you can see the results of your calibration in the existent data before applying the calibration. Optionally, two reference devices with their corresponding gas can be selected.

Figure 55 – Baseline calibration: check data
9.1.3.4 Show result
Before applying the calibration, the chart specified in the previous step will be plotted showing how the calibration will be. The curves that will appear in the chart shown in Figure 9 – Baseline calibration: apply calibration are:
· Blue line (K-A14 Device 16-NO2 GC cal) is the calibrated concentration. The tag follows the format '{calibrated device name}-{gas name} cal'.
· Red line (K-A14 Device 16-NO2 GC) is the original concentration. The tag follows the format '{calibrated device name}-{gas name}'.
· Green line (RS Antwerpen ref-PM10 ref) is the reference sensor. Up to two reference sensors can be selected and they will be tagged as '{reference device name}-{ sensor name} ref'.
The statistics of calibration against reference are calculated with the original data and with the calibrated data. It shows the R2, the Minimum Absolute Error (MAE), the expanded uncertainty (U(exp)%) and the values above the Limit Value set by the Data Quality Objectives of the European Directive 2008/50/EC.


Figure 56 – Baseline calibration: apply calibration
If the values of the chart are correct, it exists the possibility to “Rebuild Historical data”, as appeared in Figure 10 – “Rebuild historical data” option, by overwriting the data with the new calibrated values over the selected period by clicking on the “Yes” option when asking to rebuild the data. Besides, you have the possibility to register the calibration in the CMMS:
· Register calibration action in the Logbook (CMMS): it will appear in the Logbook, the device calibrated, the person who carried out the calibration, the description of the calibration (for instance, “Baseline calibration – NO2”), and the time period for which the calibration was applied.
· View for all users: check this option if you want that all the users that have the device linked, can see the calibration done.
· Generate notification: it will generate a notification to other users that calibration was performed.

Figure 57 – “Rebuild historical data” option
Finally, by clicking on the “Apply” button a confirmation dialog message will be shown. Clicking on “YES”, a completed message will appear at the top-right of the web. The new settings will be queued and applied to start from the next communication period.
In case that the preliminary result of the calibration is not as expected, just click on “Cancel” button to abort the calibration or click on “Previous” to modify the settings.
9.1.3.5 Example
Before calibrating a gas, we need to study its behavior to detect a specific period where we know how it should behave.
Let us suppose we want to calibrate the NO2 concentration of an air quality device tagged as 'K-A14 Device 16'. This device has the following NO2 historical data (Data > Standard):

Figure 58 – Baseline calibration: preliminary concentration analysis
We are going to use another device as a reference (‘RS – Antwerpen ‘). This device should be placed in the same location as the one we want to calibrate.
As it is known, NO2 tends to be zero during the night in the location where both devices are located. In this case, the period between 01:00 and 03:00 should show a mean concentration of zero.
Once the preliminary concentration analysis is performed, you can start with the baseline calibration from “Operation” tab > “Gas & Particle Calibration” > “Gas calibration”.
The first step is to select the 'K-A14 Device 16” device and the NO2 sensor in the multiple device and single gas selectors:

Figure 59 – Baseline calibration example: select device and gas
Since the NO2 concentration should be zero from 01:00 to 03:00, we will select a period of 2 hours, starting the 2021-01-21 at 02:00 am in step 2:
Figure 60 – Baseline calibration example: select calibration period
Once the calibration period has been selected, in step 3 you must select the period to be analysed. This period is a simulation of the calibration applied to already stored concentration values:
Figure 61 – Baseline calibration example: check data
The mean of the calibrated concentration during the selected calibration must be 0, and this can be checked in step 4:


Figure 62 – Baseline calibration example: average concentration within the calibration period
Applying a zoom on the desired period, the mean is 0, so the calibration has worked as expected. Now let's see the effects of the calibration on the original curve:
Applying zoom out on the whole selected period, the curve offset has decreased, and it is now quite similar to the reference curve of the ' RS – Antwerpen ' device:
Figure 63 – Baseline calibration example: calibrated curve vs reference curve
The calibration seems to be correct so now we can “Rebuild the Historical Data” by clicking on the “Yes” option and select as required the different “CMMS options”. Finally, apply the calibration by clicking on the “Apply” button.
After confirming the calibration, the new settings will be queued and applied to start from the next communication period.
9.1.4 Span calibration
This calibration consists of adjusting the sensor's span by finding a period in which the gas concentration reached a maximum reference value, or failing that, a very high value. It modifies the sensitivity of the air quality sensors so the concentration span will change accordingly. The span value will be expanded upon setting a maximum value higher than current concentrations, while it will be constrained upon setting a maximum value lower than current concentrations. It is very important to note that this calibration will not work correctly if the values applied are not the maximum or the highest values concentrations, since it modifies the sensitivity parameter of the gas sensors.
|
|
NOTE: Please take into account that a previous baseline calibration must be done or be sure that the baseline is correct. |
Gases will hit a maximum concentration, or peaks of concentration, during a certain part of the day. For example, it is possible to find high gas concentrations in the city center during the early morning hours due to the dense car traffic. The user must find these periods to perform a correct span calibration when compared with a GOLD unit or reference instrument.
To calibrate the span, it is recommended to take high concentration values as a reference. The recommended minimum values are shown in Table 2 – Minimum recommended values for calibrating the span.
|
Parameter |
Minimum values recommended |
|
Carbon monoxide (CO) |
700 ppb |
|
Carbon dioxide (CO2) |
1000 ppm |
|
Ozone (O3) |
40 ppb |
|
Nitric oxide (NO) |
40 ppb |
|
Nitrogen dioxide (NO2) |
40 ppb |
|
Hydrogen sulphide (H2S) |
40 ppb |
|
Sulphur dioxide (SO2) |
40 ppb |
|
Ammonia (NH3) |
20 ppm |
|
Volatile Organic Compounds (VOCs) |
5 ppm |
Table 67 – Minimum recommended values for calibrating the span
Follow the steps below to perform a correct span calibration through the KunakCloud web.
NOTE: The gas considered for VOCs cartridge span calibration is the Isobutylene
9.1.4.1 Calibration Type, Devices and Gas
The very first step in a calibration process is selecting the device(s) and gas to calibrate. It is possible to calibrate multiple devices at the same time by selecting them in the dropdown list or writing its tag. Note that only one gas can be calibrated at a time. To go to the next step, click on the “Next” button.

Figure 64 – Span calibration: select device & gas
|
|
NOTE: The span calibration of the carbon monoxide Type B cartridge must be done at laboratory conditions by using a CO gas bottle. Kunak recommends carrying out the CO Type B span calibration at 100 ppm of CO. |
9.1.4.2 Reference value and Period
Span calibration can only be done when comparing to a GOLD unit or a reference instrument collocated with the device under calibration.
Select the period in which the gas concentration reached the reference value. In Figure 18 – Span calibration: calibration period selection, it is selected a reference value of 51 ppb starting at 19:00 of July 22nd and for 1 hour.

Figure 65 – Span calibration: calibration period selection
In span calibration, the selected period should be a single point or a few points (when the value is constant or almost constant during a particular period). The idea is to expand or collapse the curve span (the difference between the maximum and minimum value of the concentration) by adjusting its value. The best way is to use the average hour to calibrate the span precisely.
9.1.4.3 Check data
In this step, you must select the period to be charted so you can see the results of your calibration in the existent data. Optionally, two reference devices with their corresponding gas can be selected.

Figure 66 – Span calibration: check data
9.1.4.4 Show result
Before applying the calibration, the chart specified in the previous step will be plotted showing how the calibration will be. The curves that will appear in the chart shown in Figure 20 – Span calibration: apply calibration are:
· Red line (K-A10 Demo 2 NO2 GC) is the original concentration. The tag follows the format '{calibrated device name}-{gas name}'.
· Blue line (K-A10 Demo 2-NO2 GC cal) is the calibrated concentration. The tag follows the format '{calibrated device name}-{gas name} cal'.
· Green line (K-A10 Gold 3-NO2 GCc ref) is the optional reference sensor. Up to two reference sensors can be selected and they will be tagged as '{reference device name}-{sensor name} ref'.

Figure 67 – Span calibration: apply calibration
If the values of the chart are correct, it exists the possibility to “Rebuild Historical data”, as appeared in Figure 57 – “Rebuild historical data” option, by overwriting the data with the new calibrated values over the selected period by clicking on the “Yes” option when asking to rebuild the data. Besides, you have the possibility to register the calibration in the CMMS. For more details see the Baseline calibration Section.
Finally, by clicking on the “Apply” button a confirmation dialog message will be shown. Clicking on “YES”, a completed message will appear at the top-right of the web. The new settings will be queued and applied to start from the next communication period.
In the case that the preliminary result of the calibration is not as expected, just click on “Cancel” button to abort the calibration or click on “previous” to modify the settings.
9.1.4.5 Example
It is considered in this example that the calibration is already done in the example of the baseline calibration before and it is queued to the device.
You must always be sure that the baseline calibration has been done.
This span calibration will adjust the peaks of the concentration, so the calibrated concentration will be even more similar to the reference concentration.
The NO2 concentration of the air quality device tagged as 'K-A10 DEMO 2' was the following one:

Figure 68 – Span calibration: previous concentration analysis
There was a good correlation with the concentration of the reference device (K-A10 GOLD 3). The curves are quite similar but there are still some peaks in the calibrated device that could be adjusted. We will focus attention on the interval with a peak at 19:00 from July 22nd 2020:

Figure 69 – Span calibration example: select the reference period
It is better to calibrate the span taking into account the average hour because the error made during calibration will be smaller.
We will try to adjust the span to the average NO2 concentration of the reference device. By using the average concentration as a reference, the influence of the extreme values (abnormal peaks) is decreased. The average NO2 concentration between 19:00 and 20:00 is 51 ppb for the reference and the “K-A10 DEMO 2” is 17 ppb as it is shown in Figure 69 – Span calibration example: select the reference period.
Once the reference value (51 ppb) has been found, the 'K-A10 DEMO 2” and the NO2 sensor must be selected at the calibration tool.
Figure 70 – Span calibration example: select device and gas
We will select 51 as a reference and a period from 19:00 to 20:00 from July 22nd, 2020:
Figure 71 – Span calibration example: select calibration period
As a reference, we select the 'NO2 GCc' sensors of the reference device (K-A10 GOLD 3) to check if the results are as expected:
Figure 72 – Span calibration example: show result
In this last step, we will check if everything worked as expected:
Figure 73 – Span calibration example: apply calibration
The curve has been collapsed and adjusted span. Now, we can compare this calibrated concentration with the reference one:

Figure 74 – Span calibration example: the result of combining baseline and span calibration
After confirming the calibration, the new settings will be queued and applied to start from the next communication period.
9.2 Particle calibration
Correction applied to the sensor data is particularly important in the case of particle measurements. The state-of-the-art of PM sensing technologies applicable in compact sensors measures the particle mass density with indirect means, which are commonly based on the scattering of light from atmospheric particles. In these methods, variations in particle density, shape and optical properties inevitably create biases in the particle mass measurement. These biases can be compensated by comparison with a reference, or reference equivalent method, after typically linear correction factors (slope/intercept) are established for adjusting the sensor data. That difference or variation could be higher depending on the method used to measure in the reference instrument.
The correction factors can be stored and applied to the data at various stages of data acquisition: in the instrument itself, at a network database, or as a user applied post-processing step. It should be taken care to keep track of correction factors to avoid errors caused by applying the factors multiple times to the same data.
To apply this correction factor in the instrument itself, you can use our KunakCloud platform and do it remotely through “Particle Calibration” tool that can be found in “Operation” tab > “Gas & Particle Calibration” in the KunakCloud section.
This calibration factor can be applied in two ways: “Manual” or “Linear regression (forced origin) against reference”.
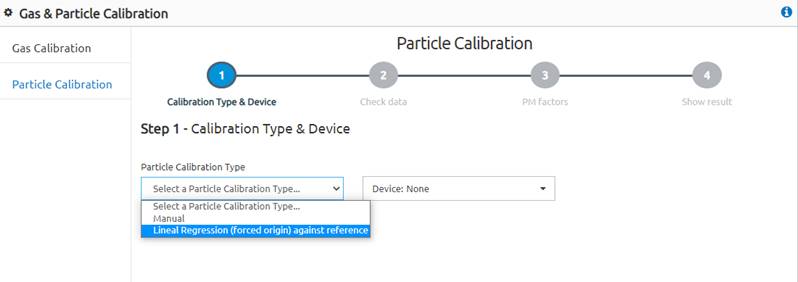
Figure 75 – Particle Calibration tool
For both particle calibration modes, place the Kunak Air device near an official reference station to carry out a colocation test. For the most accurate calibration, place the Kunak Air at a maximum distance of 2 meters from the inlet port of the reference air quality station.
The reference data used can be either a Reference Station or a GOLD device, as it occurs for gas calibrations.
The Kunak Air should be installed for at least 1 week to compare the Kunak Air PM data obtained against the reference data. After calibration, keep on the device working for at least another week to compare the data with the reference station or the GOLD device in order to guarantee a correct performance as specified in the datasheet and/or shown in the field tests that can be found at the “Support” section of the KunakCloud web.
Once the calibration has been validated, switch off the unit. Now, Kunak Air is ready to be deployed anywhere. If required, Kunak can integrate[38] into KunakCloud platform any third-party data (for example, air quality reference stations data) to make easier the calibration process.
In case you used a GOLD device, once the calibration has been validated, switch off the GOLD unit. Now, the GOLD device can be moved to another location to calibrate another device.
9.2.1 Lineal Regression (forced origin) against reference
The “Lineal Regression (forced origin) against reference” will calculate the linear regression between the reference instrument and the one that needs to be corrected. It will calculate the slope through the origin that will apply to the data.
Follow the steps below to perform a correct “Lineal Regression (forced origin) against reference” particle calibration through the KunakCloud web.
9.2.1.1 Calibration Type and Device
The very first step in a calibration process is the type of Particle Calibration, in this case, “Lineal Regression (forced origin) against reference” and then select the device to calibrate. To go to the next step, click on the “Next” button.
As an example, we use the device K-A14 Device 15.

Figure 76 – Lineal Regression (forced origin) against reference calibration tool.
9.2.1.2 Check data
In this step, you must select the period to be charted and if required to rebuild, so the PM factors used for the calibration will be calculated and then, the results of your calibration in the existent data before applying the calibration will be shown. Optionally, it exists 3 reference devices to select, one for each particle size (PM10, PM2.5 and PM1).
As an example, we choose the dates from 27th November 2020 until 4th of December 2020, and the RS – Antwerpen as reference station for the PM10, PM2.5 and PM1. Thus, we select the RS – Antwerpen in the “Reference Device with PM10” selecting box, and then, “PM10” as “Parameter PM10”. The same steps are done for PM2.5 and PM1.
To go to the next step, click on the “Next” button.

Figure 77 – Particle calibration: check data
9.2.1.3 PM Factors
The new PM factors are calculated regarding the period selected in the step before. The “New factor” calculated in the slope forced to the origin, thus the “New offset” value will remain as 0.
In the first two columns the “Current factor” and “Current offset” values appear in case another calibration was performed before. Thus, if not prior calibration was carried out, the “Current factor” and “Current offset” will be 1 and 0 respectively, as shown in Figure 31 – Particle calibration: PM factors (not previous calibration). If a calibration has been performed previously, the “Current factor” and “Current offset” will show the values applied in the last calibration, as shown in Figure 32 – Particle calibration: PM factors (previous calibration performed). In the last case, the “New factor” will be calculated with the raw PM data, not with the calibrated data. The “Current factor”(s) will be deleted, and substitute by the “New factor”(s) calculated.

Figure 78 – Particle calibration: PM factors (not previous calibration)

Figure 79 – Particle calibration: PM factors (previous calibration performed)
A constraint appears if PM10 factor is lower than PM2.5 and PM1, and if PM2.5 factor is lower than PM1. The PM10 factor must be higher than PM2.5 and PM1 factors, as well as PM2.5 factor must be higher than PM1 factor. This constraint is added in order to avoid that PM1 and PM2.5 concentration values are higher than PM10 values after the calibration.
If the “New factor”(s) calculated shows that constraint when applying them, we recommend setting the same “New factor” obtained for PM10, for the case of PM2.5 and PM1. The PM calibration tool allows changing the PM “New factor”(s) calculated.
In Figure 33 – PM calibration: factor constraint PM10 factor > PM2.5 factor > PM1 factor appears an example. “New factor”(s) are calculated for PM10, PM2.5 and PM1. The constraint notification appears since PM1factor is higher than PM10 and PM2.5. This, it is recommended to change the PM1 factor as the same value as PM2.5 factor, 1.2070069, as shown in Figure 34 – PM calibration: factor constraint corrected.

Figure 80 – PM calibration: factor constraint PM10 factor > PM2.5 factor > PM1 factor
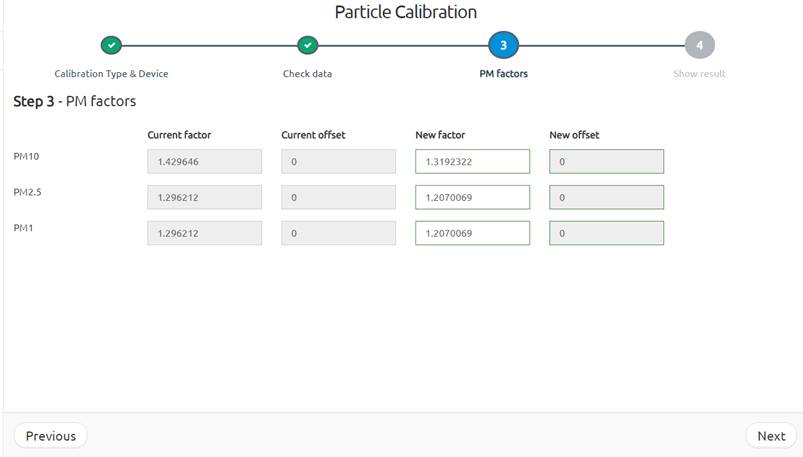
Figure 81 – PM calibration: factor constraint corrected
To select the “New factors”(s) click on “Next” button.
9.2.1.4 Show result
Before applying the calibration, the chart specified in the previous step will be plotted showing how the calibration will be. The curves that will appear in the chart shown are:
· Blue line (K-A14 Device 15 – PM10 cal) is the calibrated concentration. The tag follows the format '{calibrated device name}-{particle name} cal'.
· Red line (K-A14 Device 15 – PM10) is the original concentration. The tag follows the format '{calibrated device name}-{gas name}'.
· Green line (RS Antwerpen ref-PM10 ref) is the reference sensor. Up to three reference sensors, one for each particle size, can be selected and they will be tagged as '{reference device name}-{ sensor name} ref'.
The statistics of calibration against reference are calculated with the original data and with the calibrated data. It shows the R2, the Minimum Absolute Error (MAE), the expanded uncertainty (U(exp)%) and the values above the Limit Value set by the Data Quality Objectives of the European Directive 2008/50/EC.
If the values of the chart are correct, it exists the possibility to “Rebuild Historical data”, as appeared in by overwriting the data with the new calibrated values over the selected period by clicking on the “Yes” option when asking to rebuild the data. Only in the Particle Calibration tool, this option gives you the option to select the start and end date that you would like to rebuild data, as shown in Figure 36 – Rebuild Historical data: Dates setting. Besides, you have the possibility to register the calibration in the CMMS. For more details see the Baseline calibration Section.
Finally, by clicking on the “Apply” button a confirmation dialog message will be shown. Clicking on “YES”, a completed message will appear at the top-right of the web. The new settings will be queued and applied to start from the next communication period.

Figure 82 – Particle calibration: show results

Figure 83 – Rebuild Historical data: Dates setting
9.2.1.5 Example
Before calibrating the particles, we need to study their behavior to detect a specific period where we know how they should behave.
Let us suppose we want to calibrate the particle concentration of an air quality device tagged as 'K-A14 Device 15'. This device has the following PM historical data (Data > Standard):

Figure 84 – Particle calibration: PM1 example
We are going to use another device as a reference (‘RS – Antwerpen ‘). This device should be placed in the same location as the one we want to calibrate.
Once the preliminary concentration analysis is performed, you can start with the baseline calibration from “Operation” tab > “Gas & Particle Calibration” > “Particle calibration”.
The first step is to select the 'K-A14 Device 15” device and the NO2 sensor in the multiple devices and single gas selectors:

Figure 85 – Particle calibration example: select Particle Calibration Type and device
Then, we choose the dates from 27th November 2020 until 4th of December 2020, and the RS – Antwerpen as reference station for the PM10, PM2.5 and PM1. Thus, we select the RS – Antwerpen in the “Reference Device with PM10” selecting box, and then, “PM10” as “Parameter PM10”. The same steps are done for PM2.5 and PM1.
Figure 86 – Particle calibration example: select calibration period and check data period
The new PM factors are calculated regarding the period selected in the step before. The “New factor” calculated in the slope forced to the origin, thus the “New offset” value will remain as 0.
Figure 87 – Particle calibration example: PM factors
In step 4 the results obtained from this calibration will be shown:

Figure 88 – Particle calibration example: graph with the new calibration results from PM10
The calibration seems to be correct so now we can “Rebuild the Historical Data” by clicking on the “Yes” option and selecting the dates desired to rebuild. Select as required the different “CMMS options”. Finally, apply the calibration by clicking on the “Apply” button.
After confirming the calibration, the new settings will be queued and applied to start from the next communication period.
9.2.2 Manual
The “Manual” option allows to insert calculated PM factors, externally from the Cloud, and calculate the basic statistics with the new factors as well as apply them.
Follow the steps below to perform a correct “Manual” particle calibration through the KunakCloud web.
9.2.2.1 Calibration Type and Device
The very first step in a calibration process is the type of Particle Calibration, in this case, “Linear Regression (forced origin) against reference” and then select the device to calibrate. To go to the next step, click on the “Next” button.
As an example, we use the device K-A14 Device 15.

Figure 89 – Manual particle calibration tool.
9.2.2.2 Check data
In this step, you must select the period to be charted and if required to rebuild. The results of your calibration in the existent data before applying the calibration will be shown. Optionally, it exists 3 reference devices to select, one for each particle size (PM10, PM2.5 and PM1).
As an example, we choose the dates from 27th November 2020 until 4th of December 2020, and the RS – Antwerpen as reference station for the PM10, PM2.5 and PM1. Thus, we select the RS – Antwerpen in the “Reference Device with PM10” selecting box, and then, “PM10” as “Parameter PM10”. The same steps are done for PM2.5 and PM1.
To go to the next step, click on the “Next” button.
Figure 90 - Particle calibration: check data
9.2.2.3 PM Factors
The manual PM factors are added in the “New factor” and “New offset” windows.
In the first two columns, the “Current factor” and “Current offset” values appear in case another calibration was performed before. Thus, if not prior calibration was carried out, the “Current factor” and “Current offset” will be 1 and 0 respectively, as shown in Figure 44 – Particle calibration: Manual PM factors and offsets (not previous calibration). If a calibration has been performed previously, the “Current factor” and “Current offset” will show the values applied in the last calibration, as shown in Figure 45 – Particle calibration: Manual PM factors and offsets (previous calibration performed). The “Current factors” will be deleted, and substitute by the “New factor”(s) calculated.

Figure 91 – Particle calibration: Manual PM factors and offsets (not previous calibration)

Figure 92 – Particle calibration: Manual PM factors and offsets (previous calibration performed)
A constraint appears if PM10 factor is lower than PM2.5 and PM1, and if PM2.5 factor is lower than PM1. For more details see the Lineal Regression (forced origin) against reference Section.
To select the “New factors” click on “Next” button.
9.2.2.4 Show result
Before applying the calibration, the chart specified in the previous step will be plotted showing how the calibration will be. The curves that will appear in the chart shown are:
· Blue line (K-A14 Device 15 – PM10 cal) is the calibrated concentration. The tag follows the format '{calibrated device name}-{particle name} cal'.
· Red line (K-A14 Device 15 – PM10) is the original concentration. The tag follows the format '{calibrated device name}-{gas name}'.
· Green line (RS Antwerpen ref-PM10 ref) is the reference sensor. Up to three reference sensors, one for each particle size, can be selected and they will be tagged as '{reference device name}-{ sensor name} ref'.
The statistics of calibration against reference are calculated with the original data and with the calibrated data. It shows the R2, the Minimum Absolute Error (MAE), the expanded uncertainty (U(exp)%) and the values above the Limit Value set by the Data Quality Objectives of the European Directive 2008/50/EC.
If the values of the chart are correct, it exists the possibility to “Rebuild Historical data”, as appeared in by overwriting the data with the new calibrated values over the selected period by clicking on the “Yes” option when asking to rebuild the data. Only in the Particle Calibration tool, this option gives you the option to select the start and end date that you would like to rebuild data, as shown in Figure 83 – Rebuild Historical data: Dates setting. Besides, you have the possibility to register the calibration in the CMMS. For more details see the Baseline calibration Section.
Finally, by clicking on the “Apply” button a confirmation dialog message will be shown. Clicking on “YES”, a completed message will appear at the top-right of the web. The new settings will be queued and applied to start from the next communication period.

Figure 93 – Particle calibration: show results
Figure 94 – Rebuild Historical data: Dates setting
9.2.2.5 Example
The same example used for the Lineal Regression (forced origin) against reference is used in this example.
Before calibrating the particles, we need to study their behavior to detect a specific period where we know how they should behave.
Let us suppose we want to calibrate the particle concentration of an air quality device tagged as 'K-A14 Device 15'. This device has the following PM historical data (Data > Standard):
Figure 95 – Particle calibration: PM1 example
We are going to use another device as a reference (‘RS – Antwerpen ‘). This device should be placed in the same location as the one we want to calibrate.
Once the preliminary concentration analysis is performed, you can start with the baseline calibration from “Operation” tab > “Gas & Particle Calibration” > “Particle calibration”.
The first step is to select the 'K-A14 Device 15” device and the NO2 sensor in the multiple devices and single gas selectors:
Figure 96 – Particle calibration example: select Particle Calibration Type and device
Then, we choose the dates from 27th November 2020 until 4th of December 2020, and the RS – Antwerpen as reference station for the PM10, PM2.5 and PM1. Thus, we select the RS – Antwerpen in the “Reference Device with PM10” selecting box, and then, “PM10” as “Parameter PM10”. The same steps are done for PM2.5 and PM1.
In this case, the selected period is only used for checking the data, not for obtaining the new factors because they will be calculated by the user and include manually.
Figure 97 – Particle calibration example: select calibration period and check data period
This step allows to include the “New factor” and “New offset” manually:
Figure 98 – Particle calibration example: PM factors
In step 4 the results obtained from this calibration will be shown:

Figure 99 – Particle calibration example: graph with the new calibration results from PM10
The calibration seems to be correct so now we can “Rebuild the Historical Data” by clicking on the “Yes” option and selecting the dates desired to rebuild. Select as required the different “CMMS options”. Finally, apply the calibration by clicking on the “Apply” button.
After confirming the calibration, the new settings will be queued and applied to start from the next communication period.
10. OPTIONAL COMMUNICATIONS
10.1 Modbus Master
![]() Only applies to devices with Part Number “K-A3-14-1”.
Only applies to devices with Part Number “K-A3-14-1”.
Extra probes can be connected to the Kunak Air Pro device by Modbus. The Kunak Air Pro device will work as Modbus Master and will read periodically the data of the external probe connected. The probe must work as Modbus Slave. The data of the probe read by the device, will be sent to Kunak Cloud as the rest of the sensors of the Kunak device.
The Modbus RTU is a communication that complains with the electrical characteristics of the RS485 standard.
To find out which connector on the device corresponds to the Modbus, go to the specification section of the device.
The connector needed for the communication between the Kunak Air Pro device and the Modbus Slave probe is a M12 male connector type A and the pinout is described below.
![]() No cable or converter device is provided, only the connector so that
the customer can connect it to his application freely.
No cable or converter device is provided, only the connector so that
the customer can connect it to his application freely.
The probe can be powered from the Kunak AIR device with 12V and a maximum of 2W. If the power consumption of the probe is above, it will not work properly and can damage the Kunak AIR device. If the probe needs more power, it is recommended to supply it from an external source.
|
Figure 100 – Position of pin M12 8A for Modbus |
Table 68 – Modbus M12 8A pinout |

![]() In case the Modbus do not work, please check the connections and
make sure that A+ and B- signal lines are not swapped.
In case the Modbus do not work, please check the connections and
make sure that A+ and B- signal lines are not swapped.
The Kunak AIR Pro device will work as a Modbus RTU master (not isolated). It provides Modbus communication through a RS-485 serial port whose default configuration is the following:
|
Characteristic |
Value |
|
Type |
Modbus RTU Slave |
|
Insulation |
|
|
Baud Rate |
19200 bit/s |
|
Data Bits |
8 |
|
Parity |
Even |
|
Bits Stop |
1 |
Table 69 – Modbus default configuration
The configuration of the Modbus registers that the device has to collect from the probe, have to be configured beforehand. The configuration must be done with the “Kunak device configurator”.
Also, the power source VS2 must be configured and the preheat that is the amount of time before taking the data from the probe that the power should be switched on.
10.2 Modbus Slave
The Kunak AIR device enables the possibility to retrieve the collected data to Modbus control applications by working as Modbus Slave. The Kunak AIR device works periodically monitoring several environmental parameters and it allows Master applications to read the latest available value from its dedicated registers.
Once the Kunak AIR device is switched on, it will start its operation by initializing all its hardware components. Then, it will connect to Kunak Cloud web server to synchronize its configurations and at last, it will be ready for Normal Operation periodically measuring all the environmental parameters and sending them over to Kunak Cloud. By default, the device is configured to communicate data to the Kunak Cloud, but it can be configured to only send data via Modbus with the “Kunak device configurator”.
The time needed by the Kunak AIR Modbus Slave device to be responsive on Modbus after power on is typically around 30 seconds after the power on.
To find out which connector on the device corresponds to the Modbus, go to the specification section of the device.
The Modbus RTU is a communication that complains with the electrical characteristics of the RS485 standard
The device is supplied with an M12 male connector type D and the pinout is described below. No cable or converter device is provided, only the connector so that the customer can connect it to his application freely.
|
Figure 101 – Position of pin M12 4D for Modbus |
Table 70 – Modbus M12 4D pinout |

The Kunak AIR device works as a Modbus RTU Slave (not isolated). It provides Modbus communication through a RS-485 serial port whose default configuration is the following:
|
Characteristic |
Value |
|
Type |
Modbus RTU Slave |
|
Insulation |
|
|
Baud Rate |
19200 bit/s |
|
Data Bits |
8 |
|
Parity |
Even |
|
Bits Stop |
1 |
|
Slave Address |
163 (A3 in hexadecimal format) |
Table 71 – Modbus default configuration
In case no response is received from Kunak AIR Modbus Slave please check the connections and make sure that A+ and B- signal lines are not swapped.
10.2.1 Serial Communication functional description
The Kunak AIR Modbus Slave Device supports the following Modbus RTU function codes:
· Function code 3: Read Holding Registers, to read device’s configurations.
· Function code 4: Read Input Registers, to read device’s measurements.
· Function code 6: Write Single Register, to modify device’s Modbus configurations.
No other Modbus Protocol function is supported by the Kunak AIR device, and it will be treated as an Illegal Function on the bus.
Modbus Protocol design is based on 16bits registers therefore 32 bits variables must be represented by using two consecutive registers. Kunak AIR Modbus slave device represents 32 bits variables as follows:
· Serial Number 0x12345678
o Registers 40202,40203
o Register values: 40202 = 0x1234
o Register values: 40203 = 0x5678
10.2.2 Modbus registers
10.2.2.1 Modbus Configuration Registers
In this section are described device’s Modbus configuration registers: data is represented as 16 bits unsigned integer.
These registers are the only read/write registers of the Kunak AIR Modbus Slave device and can be modified by writing to them with the function Write Single Register.
To make operative the new configuration the Kunak device MUST be reset.
Once configuration becomes operative, it will be stored in the device non-volatile memory and it will become the new device default configuration.
|
|
NOTE: To properly modify Kunak Modbus Slave device configuration and make sure that the device stores it in non-volatile memory, these registers can be written in every device status different from Standby. |
In the following table, Kunak AIR Modbus device configuration parameters and their value ranges are reported; in case of writing an out-of-range value to one of these registers, it will be rounded to the closest available in range value.
|
Parameter |
Address |
Value |
|
Slave Address |
40301 |
Value range: 1 to 247 Default: 163. |
|
Baud rate |
40302 |
Value range: 1. 96 2. 192 3. 576 4. 1152 Default: 192. Baud rate is represented as the real value divided by 100: i.e., 9600 bps is 96. |
Table 72 – Modbus Configuration Registers
10.2.2.2 Measurements Registers
The Kunak AIR device stores its parameters measurement values into Modbus Input registers.
The following table describes the available registers of the Kunak AIR device for the environmental data.
All registers are encoded as 16 bits signed integers and to get its floating-point representation a scaling factor MUST be applied to the raw integer value.
Value “-32768” is used to represent that no data is available for the given environmental parameter.
|
|
NOTE: Measurement registers value is meaningless if device status is different from Normal Operation, if any of these registers are read while the device status is not Normal Operation the reading should be discarded. |
|
Parameter |
Address |
Units |
Scaling Factor |
|
Battery |
30001 |
% |
1 |
|
Charge |
30002 |
Volts |
0.01 |
|
Gas Cartridge 1 GCC |
30003 |
ppb/ppm - *see configuration |
1 for ppb - 0.01 for ppm |
|
Gas Cartridge 2 GCC |
30004 |
ppb/ppm - *see configuration |
1 for ppb - 0.01 for ppm |
|
Gas Cartridge 3 GCC |
30005 |
ppb/ppm - *see configuration |
1 for ppb - 0.01 for ppm |
|
Gas Cartridge 4 GCC |
30006 |
ppb/ppm - *see configuration |
1 for ppb - 0.01 for ppm |
|
Gas Cartridge 5 GCC |
30007 |
ppb/ppm - *see configuration |
1 for ppb - 0.01 for ppm |
|
External Temperature |
30008 |
C |
0.01 |
|
Humidity |
30009 |
% |
0.01 |
|
Dew Point |
30010 |
C |
0.01 |
|
Pressure |
30011 |
hPa |
0.1 |
|
Particles, PM1 |
30012 |
µg/m3 |
0.1 |
|
Particles, PM2.5 |
30013 |
µg/m3 |
0.1 |
|
Particles, PM10 |
30014 |
µg/m3 |
0.1 |
|
WBGT – Wet Bulb Globe Temperature |
30015 |
C |
0.01 |
|
Wind Direction, AVG |
30016 |
Degrees |
0.01 |
|
Wind Speed, AVG |
30017 |
Km/h |
0.01 |
|
Wind Speed, MAX |
30018 |
Km/h |
0.01 |
|
Rainfall |
30019 |
mm |
0.01 |
|
Noise, Laeq |
30020 |
dB |
0.01 |
Table 73 – Measurements registers
10.2.2.3 Measurements timestamps Registers
Data is represented as a 32 bit UNIX timestamp in 2 consecutive 16 bits registers.
|
|
NOTE: Timestamp registers value is meaningless if device status is different from Normal Operation, if any of these registers are read while the device status is not Normal Operation the reading should be discarded. |
|
Parameter |
Address |
|
Battery Measurement Timestamp |
40001 |
|
Charge Measurement Timestamp |
40003 |
|
Gas and Environment Measurement Timestamp |
40005 |
|
Particles Measurement Timestamp |
40007 |
|
Noise Measurement Timestamp |
40009 |
|
Wind Measurement Timestamp |
40011 |
|
Rainfall Measurement Timestamp |
40013 |
Table 74 – Register table for Measurements timestamps
10.2.2.4 Gas Cartridges Configurations Registers
The Kunak AIR device stores its configuration values into Modbus Holding registers. These registers are read only registers and an attempt to write them will produce an Illegal Function error on the bus.
Data is represented as 16 bits unsigned integer.
For the detailed representation of register values see next sections.
|
|
NOTE: Cartridge Configuration registers value is meaningless if device status is Start-up, if any of these registers are read while the device status is Start-up the reading should be discarded. |
|
Parameter |
Address |
Value |
|
Gas Cartridge 1 config |
40101 |
High byte: Gas Type, Low byte: Gas Units |
|
Gas Cartridge 2 config |
40102 |
High byte: Gas Type, Low byte: Gas Units |
|
Gas Cartridge 3 config |
40103 |
High byte: Gas Type, Low byte: Gas Units |
|
Gas Cartridge 4 config |
40104 |
High byte: Gas Type, Low byte: Gas Units |
|
Gas Cartridge 5 config |
40105 |
High byte: Gas Type, Low byte: Gas Units |
Table 75 – Register Table for Gas Cartridge Configuration
Gas Cartridge configuration is a 16 bit unsigned integer that represents the configuration of every cartridge of Kunak AIR device in terms of gas type and gas concentration units.
Gas Units byte available values:
· 0, ppb
· 1, ppm
Gas Type available values:
· 0, CO – Carbon Monoxide
· 1, NO – Nitrous Oxide
· 2, NO2 – Nitrogen Dioxide
· 3, O3 - Ozone
· 4, SO2 – Sulphur Dioxide
· 5, H2S – Hydrogen Sulphide
· 6, NH3 - Ammonia
· 7, VOC – Volatile Organic Compounds
· 8, VOC-B – Volatile Organic Compounds
· 9, CO-B – Carbon Monoxide for High Concentrations
· 10, CO2 – Carbon Dioxide
· 255, Cartridge Not Available
10.2.2.5 Device Status and Miscellaneous Registers
The Kunak AIR device stores its configuration values into Modbus Holding registers. These registers are read only registers and an attempt to write them will produce an Illegal Function error on the bus.
Data is represented as 16 bits unsigned integer.
For the detailed representation of register values see next sections.
|
Parameter |
Address |
Value |
|
Device Status |
40201 |
High byte: device status, Low byte: latest error |
|
Device Serial Number |
40202 |
32bits unsigned integer in 2 consecutive registers |
|
Firmware Version |
40204 |
High byte: Fw version Major, Low byte: Fw version minor |
Table 76 – Register table for Device Status and Miscellaneous
Device Status register is a 16 bit unsigned integer value that represent the combination of current device status in its high byte and the latest detected error in the lower byte.
Device Status Available Values
· 1, Device Status Start-up: in this status device is initializing its internal modules and hardware components.
· 2, Device Status Config: in this status device is available for external configuration.
· 3, Device status Synch: in this status device is synchronizing its configuration with Kunak Cloud server.
· 4, Device status Normal Operation: in this status device is periodically taking measurements.
· 5, Device status Standby: in this status device is suspended.
10.2.3 Modbus Slave Example
For the example of use it has been used:
· The device is supplied with an M12 male connector.
· RS485 to USB converter: DSD Tech SH-U10 converter with chip CP2102
o Where to buy:
o Drivers (normally not needed):
§ https://www.silabs.com/developers/usb-to-uart-bridge-vcp-drivers
· Cable of 2 wires
· PC
o PC Modbus Poll (Modbus master simulator) (free trial of 30 days):
§ https://www.modbustools.com/modbus_poll.html
o Website to format the Modbus requests:
§ https://npulse.net/en/online-modbus
At the start of the “Modbus Slave” section are the specifications of the wired connections. Below can be found some pictures of the wire connection between the connector and the converter.

Figure 102 – Connection diagram Modbus from Kunak AIR to DSD Tech SH-U10

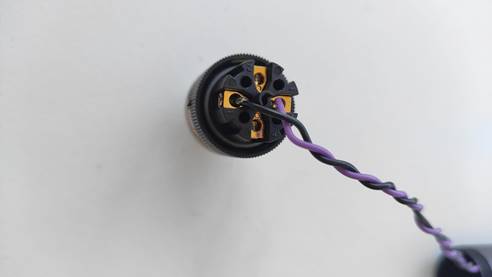
Figure 103 – Example of Modbus connection
With the Kunak AIR device connected to the PC, Start Modbus poll program and follow the steps below.
1. Press F3 or “Connection > Connect…” and configure the Modbus with its settings

Figure 104 – Configuration of the Modbus connection
2. Press F8 or “Setup > Read/Write Definitions…” and configure the registers to read.

Figure 105 – Configuration of the Modbus register to read
3. Select display option. For the case of the S/N is a 32-bit unsigned value therefore select “Display > 32-bit Unsigned > Big-endian”

Figure 106 – Change the display view of the Modbus data
4. With the settings applied, you will get the S/N of the device. In the example is the S/N:01244917

Figure 107 – Read of the S/N by Modbus
5. To read the information of the sensor, press F8 again and change the registers to read

Figure 108 – Change of the Modbus register
6. As the data read is of 16-bit and with sing, select “Display > Signed”

Figure 109 – Sensors reads by Modbus
11. TROUBLESHOOTING & IMPORTANT NOTICES
11.1 Device Identification
The minimum information needed to identify each Kunak AIR Pro device is shown in the label that can be found near the display at the bottom of the device.

Figure 110 – Kunak AIR Pro identification
The label is composed by:
· Model: commercial name of the device.
· Manufactured: Year of manufacture of the device.
· P/N: The part number shows the characteristics of the device acquired. More info below.
· S/N: The Serial Number of the device. It is unique for each device.
· Rated power: characteristics of the power supply needed to charge the device.
11.2 Troubleshooting
If the normal start-up procedure fails for any reason or no samples are shown in the Kunak Cloud platform, the user can check the device to solve the different problems described below.
· If APN or PIN configuration problem, please restart the device, attach the USB cable to the device and the PC, reconfigure the wrong parameter with the software Kunak device configurator and try again.
· If low signal is detected, a change of localization with better coverage is recommended.
· If low battery, recharge the device. Check that the power supply is correctly attached to Kunak AIR Pro. If the battery is completely discharge, the device will not work until its charge reaches 20%, please, be patient.
· No sensor data in the start-up could be due to the sensor stabilization period. The time of stabilization can variate depending on how much the device was switched off before starting it.
· No sensor data. Please check the operation alarms of the device at the Kunak Cloud platform for more details about the issue (only for devices with operational packages).
· If no particle data is available, the OPC might be switched off for security when the variable OPC_SFR is very low. This prevents breaking the sensor because the inlet or outlet of the sensor can be stuck. To solve it, reboot the device remotely to confirm that is stuck. If stuck, clean up the OPC inlet and outlet. See Maintenance Particle sensor Cleaning.
In addition, if the problem is related to sensor, cartridge or particle data, it is recommended to register the malfunction in KunakCloud under the CMMS menu . The instructions for using CMMS are available here.
11.3 Support Information
In Kunak Cloud (www.kunakcloud.com), inside the Support
Area ( ![]() ), it is possible to
find the last manuals, videos, software, etc required to use or any doubt about
all the Kunak devices and services.
), it is possible to
find the last manuals, videos, software, etc required to use or any doubt about
all the Kunak devices and services.

If you have some issues with the device, you can contact your distributor or to our Kunak support team by:
· Email: [email protected]
· Phone: +34 848470055
Scan the QR code to get more information about the Kunak AIR Pro device or visit our web page https://kunakair.com/air-pro/ .
|
|
Video tutorials of Kunak Air Pro |
|
|
Complete User Manual |
|
|
Help articles |


11.4 Repair Service (RMA)
All returned material must have a valid Kunak RMA number. This number is necessary to ensure proper tracking and handling of returned material at the factory. Do not return any product until an RMA is issued. Kunak reserves the right to refuse shipments that do not have an authorized RMA number. Refused shipments will be returned to the shipper via collect freight.
The RMA number is given by the support department. You can contact the support department with the Kunak Support Center form.

Figure 111 – Repair service (RMA)
More information at: https://kunakair.com/support/repair-service/
11.5 Recycling
|
|
The electronic and mechanical parts of Kunak Smart Gas Cartridges can be reused, making Kunak AIR Pro the most sustainable Air Quality sensor-based station in the market. |
|
|
This device must be disposed of according to local regulations. We suggest handling it to a specialized electronic recycling facility |


Table 77 – Recycling
11.6 Terms and conditions
Please observe that any such warranty may not be valid in case of damage due to normal wear and tear, exceptional operating conditions, negligent handling or installation, or unauthorized modifications.
For standard warranty terms and conditions, see:
· Hardware Equipment Purchase Agreement https://kunakair.com/doc/12.Terms_Conditions/Kunak_Hardware_Equipment_Purchase_Agreement_EN.pdf
· Hardware Equipment Rental Agreement https://kunakair.com/doc/12.Terms_Conditions/Kunak_Hardware_Equipment_Rental_Agreement_EN.pdf
· Cloud Software SaaS Agreement https://kunakair.com/doc/12.Terms_Conditions/Kunak_Cloud_Software_SaaS_Agreement_EN.pdf
· Declaration of Conformity CE https://kunakair.com/doc/12.Terms_Conditions/Kunak_Air_Pro_CE_declaration_of_conformity.pdf
· Declaration of Conformity FCC https://kunakair.com/doc/12.Terms_Conditions/Kunak_Air_Pro_FCC_Supplier_s_declaration_of_conformity.pdf

