A refinery does not fail all at once, it fails drop by drop, through leaks that are invisible to the naked eye yet dangerously constant, through emissions that no one measures in time.
Emissions monitoring in refineries is now one of the most critical operational priorities in the oil and gas sector, and also one of the hardest to carry out. Refining facilities handle volatile mixtures of gases such as methane (CH4), nitrogen oxides (NOx), sulphur dioxide (SO2), hydrogen sulphide (H2S) and volatile organic compounds (VOC)Volatile Organic Compounds (VOCs) are chemical substances primarily composed of carbon and hydrogen, but they can also contain other elements such as oxyge...
Read more, in environments where an undetected leak means an environmental and regulatory risk, but also a direct product loss and a potential accident hazard.
Traditional LDAR programmes, based on periodic inspections and manual measurements, are no longer enough to respond to the scale and speed of modern processes. The answer lies in continuous control through distributed sensor networks that turn air qualityAir quality refers to the state of the air we breathe and its composition in terms of pollutants present in the atmosphere. It is considered good when poll...
Read more into an operational variable that can be measured, traced and acted on in real time. A well-designed measurement infrastructure makes it possible to detect fugitive emissions before they escalate, document compliance with regulations such as the Industrial Emissions Directive (IED) or regulatory limits, and turn environmental data into operational intelligence.
In this article, we look at how an emissions monitoring system for refineries is structured, which parameters matter most, how sensors are integrated into LDAR programmes and what role continuous measurement plays in environmental compliance across the sector.
The challenge of controlling complex emissions in modern refineries
A refinery is not a collection of isolated pieces of equipment. It works as a highly interconnected industrial system, where each process unit is linked to multiple assets, lines and transfer points. It is a live system where pressure, temperature, flow rate and operating status are constantly interacting. That is where any variation can turn into an emission no one expected.
Air Quality Innovation in Just 1 Click
Stay informed about the air you breathe!
Subscribe to our newsletter to receive the latest updates on environmental monitoring technology, air quality studies, and more.
This complexity translates into thousands of potential emission sources spread across the facility. Valves, flanges, storage tanks, compressors and flare systems can release gases continuously or intermittently, often with no visible signs and no alarms. And without continuous measurement. These leaks can remain active for days or weeks before they are identified.
Not all emissions follow a stable pattern either. That is when the problem gets worse. Emissions do not behave in a stable way, and operational changes, maintenance, start-ups or shutdowns create variations that make them hard to identify using conventional methods, because those methods do not capture what is happening with enough resolution. That is why theoretical inventories or spot campaigns are not enough to reflect what is really happening on site.
This technical challenge comes with growing regulatory pressure. European and international rules demand traceable, representative and comparable data over time, forcing refineries to move towards continuous monitoring models. Estimating emissions is no longer enough, they must be measured accurately, documented and demonstrated.
The main challenge is not only to detect pollutants. It is to understand when they occur, where they start and why they happen. Answering those three questions in real time is what marks the difference between reactive management and active emissions control. This approach, more effective, transparent and above all aligned with today’s environmental compliance requirements, is the path modern refineries are taking.
Why refineries are critical sources of atmospheric emissions
Refineries bring together a wide range of industrial processes that run continuously and under demanding conditions. That is precisely where the problem starts. This combination of technical complexity, number of assets and operational variability makes them one of the environments with the highest emission potential in the industrial sector.
Operational complexity and thousands of potential leak points
A refinery brings together physical and chemical processes that run simultaneously and continuously, from distillation to the treatment of intermediate products. Each of these processes requires pressurised equipment, mechanical connections and storage systems that together create a very dense map of emission sources.
In practice, a facility may contain tens of thousands of potentially emitting components. Items such as valves, flanges, pumps and mechanical seals are exposed to wear, thermal changes and demanding conditions, pressure cycles and accumulated fatigue, that make leaks inevitable. According to the emission factors listed in EPA AP-42 (Compilation of Air Pollutant Emission Factors from Stationary Sources), these diffuse losses represent a significant share of total emissions in the sector. They do not follow a uniform pattern either, and they can appear anywhere in the plant, even in equipment that seems to be in good condition.
This level of complexity makes it unworkable to rely only on manual inspections or periodic estimates. That is not a strategy, it is an accepted margin of error. Visible emissions versus invisible fugitive emissions.
In a refinery, two very different realities exist side by side. Visible emissions, linked to combustion processes or flares, are the easiest to identify and are usually subject to continuous stack monitoring. Then there are fugitive emissions, released diffusely and with no obvious sign, and these are the most dangerous because they give no warning.
Fugitive emissions, such as methane and volatile organic compounds, disperse at low concentration and intermittently. This makes them hard to detect with traditional methods.
The IEA Methane Tracker, from the International Energy Agency, points out that a significant share of methane emissions in oil and gas comes precisely from leaks that are not detected in time. These emissions, although invisible, have a much greater climate impact and contribute directly to the increase in the greenhouse effect.
That is why telling apart what can be seen from what cannot is essential to understand the real problem. The most serious emissions are not always the most obvious. That imbalance is at the core of the issue.
Environmental, economic and reputational impact
Each leak has three dimensions that are rarely assessed together:
- Environmental: gases such as SO2, NOx or VOC contribute to the formation of ground-level ozone and secondary particles, with effects on human health described in the IPCC AR6.
- Operational: a methane or light hydrocarbon leak is at the same time a product loss and a direct reduction in process efficiency and in the profitability of the facility.
- Strategic: exceeding limits, lack of traceability or non-representative data expose the facility to penalties, operating restrictions and requests for additional investment. And beyond the regulator, financial markets and social pressure now demand a level of environmental transparency that leaves no room for vague estimates.
Emissions are no longer only an environmental problem. They are a factor that shapes industrial operations, economic viability and the public perception of the facility.
Main pollutants in refineries and oil and gas plants
Emissions in refineries do not respond to a single type of pollutant. They result from multiple simultaneous processes. A mix of gases and particles with very different behaviour, impacts and measurement requirements. Identifying which compounds are present and how they evolve is key to prioritising monitoring and assessing their real impact on the environment.
Methane (CH4) and fugitive emissions
Methane is one of the most relevant gases emitted in oil and gas facilities, and one of the hardest to control because it is mainly released as fugitive emissions. These leaks originate in pressurised equipment, connections or storage systems, and are typically released intermittently, with no visible signal.
Its impact is not only linked to the volume emitted, but to its global warming potential, which is significantly higher than CO2 over short time horizons. According to the United States Environmental Protection Agency (US EPA) refinery sector risk assessment, a large share of these emissions is not detected during conventional inspections, reinforcing the need for continuous measurement.
In addition, methane acts as an operational indicator of product losses. Detecting abnormal increases makes it possible to locate active leaks and reduce both environmental impact and the operational cost linked to product loss.
Volatile organic compounds and benzene
VOCs include a wide range of hydrocarbons that easily evaporate at ambient temperature and disperse quickly. In refineries, they are mainly generated during storage, loading and product transfer processes.
Among them, benzene requires special attention. It stands out due to its toxicity and its direct impact on human health. Long-term exposure to this compound is associated with cancer risk, which has led to strict limits in international regulations.
The World Health Organization (WHO) Air Quality Guidelines 2021 highlight the need to control these pollutants even at low concentrations, since their effects do not always have a safe threshold. This is why their monitoring requires high sensitivity and the ability to detect low-level temporal variations.
NOx, SO2 and combustion-related pollutants
Combustion processes in furnaces, boilers and flares generate emissions of nitrogen oxides (NOx) and sulphur dioxide (SO2), two of the most relevant regulated pollutants in the sector.
Nitrogen oxides contribute to the formation of ground-level ozone and secondary particles, while sulphur dioxide is linked to atmospheric acidification and sulphate aerosol formation. Both have direct effects on air quality and respiratory health.
Data from the European Environment Agency (EEA) show that industrial facilities, including refineries, remain a major source of these pollutants in Europe. Their control requires both source reduction technologies and measurement systems capable of verifying compliance with regulatory limits using traceable data.
Particles and flare-related emissions
Flares are essential for the safe handling of excess gases, but they generate emission peaks when combustion conditions are not optimal.
Particle emissions in refineries are closely linked to incomplete combustion processes in flares. These include PM10 and PM2.5, fractions capable of penetrating the respiratory system. Their intensity increases during incomplete combustion episodes, influenced by air to fuel ratios or flow variability.
Flare emissions are time-variable and irregularly distributed. Without continuous monitoring, it is not possible to link emission events to specific operating conditions and, therefore, it becomes impossible to act on their causes. The diversity of pollutants in refineries requires a multi-parameter approach that makes it possible to understand what is being emitted and at the same time how it evolves depending on operations and environmental conditions.
From periodic inspection to continuous control: the evolution of monitoring
For decades, managing emissions in refineries has relied on periodic campaigns and indirect estimates, sending teams into the field and waiting for data. However, the real variability of emissions and regulatory pressure have driven a shift towards continuous, data-based monitoring models capable of reflecting the actual behaviour of the facility at any moment.
Limitations of traditional LDAR campaigns
LDAR programmes (Leak Detection and Repair) have been the backbone of fugitive emissions management in the sector. Their logic is clear: they rely on periodic inspections of specific components using portable equipment to detect and repair leaks. It works, up to a point.
While this approach allows identifying specific emission points, it presents relevant limitations between inspection intervals. A leak that appears the day after an inspection can remain active for weeks before being detected in the next cycle. And spot measurements, by definition, do not reflect operational variability in facilities where conditions are constantly changing, such as refineries.
Another critical aspect is data representativeness. Spot measurements do not always reflect real operational variability, especially in environments where conditions change frequently. The data exists, but it does not always represent what is actually happening in the plant.
Advantages of fenceline monitoring
Fenceline monitoringAtmospheric conditions are essential to prevent damage to human health and to reduce the causes of increased mortality or serious effects of exposure to po...
Read more introduces a different approach based on continuous measurement around the facility perimeter. Instead of focusing only on equipment, it assesses the real impact of emissions at the facility boundary through continuous measurement. There is no need to know the exact source to detect that something is happening.
Fenceline monitoring makes it possible to identify concentration increases linked to fugitive emissions and correlate them with operational conditions or meteorological factors.
The US EPA Method 325, specifically designed for benzene monitoring at industrial perimeters, defines the technical framework and implementation criteria for this type of monitoring. The result is a more complete view of the actual behaviour of the facility, not just its equipment.
Real-time multi-parameter monitoring
Technology has enabled what was previously not feasible. The deployment of sensor networks capable of measuring multiple pollutants (CH4, VOC, NO2, SO2) simultaneously and continuously. In a refinery, where gases of different nature and origin coexist, this multi-parameter approach is not optional, it is necessary.
Measuring several pollutants in parallel allows detecting patterns, correlations and anomalies that are not visible with isolated systems. In addition, integrating meteorological variables such as wind, atmospheric stability and temperature helps interpret pollutant dispersion and identify their origin. This is when environmental data stops being a record and becomes an operational tool. It is no longer just about recording concentrations, but about understanding data evolution and anticipating risk situations.
Integration with analysis and reporting platforms
Continuous data only creates value if it can be processed, contextualised and turned into decisions. Environmental management platforms allow centralising information from multiple sensors and large data volumes, configuring real-time alerts, linking emissions to specific operational events and generating reports aligned with regulatory requirements.
In Europe, the Industrial Emissions Directive (IED) reinforces this need. It states that data must be reliable, traceable and accessible to meet audit requirements. In this context, digitalisation is no longer an operational improvement, it is a compliance requirement.
The shift towards connected, real-time systems marks the transition from reactive management to active emissions control with the ability to anticipate, not just respond.
Technical architecture of a monitoring network in refineries
A poorly placed sensor generates accurate data about the wrong location. In industrial monitoring, system architecture matters as much as the technology behind it.
In environments such as refineries, where emissions are variable and distributed, the technical architecture, design, validation and maintenance, determines the real quality of the data and its operational value.
Network design and spatial coverage
The starting point is not how many sensors to install, but where and why. Sensor network design must respond to the physical layout of the facility and to the process units that act as potential emission sources. It is not about placing sensors evenly, but about positioning them strategically based on risks, processes and dispersion conditions.
Factors such as prevailing wind direction, atmospheric dispersion, process unit location or the presence of storage tanks directly influence the required coverage. A uniform distribution may look rigorous on paper, but it can leave blind spots in practice. A well-designed network allows detecting concentration gradients, identifying critical areas more precisely and linking emission events to their likely origin.
Sensor density directly affects this capability. Insufficient coverage reduces spatial resolution, while an optimised distribution turns the network into a detection system, not just a recording one.
Data classification and traceability
For data to be useful in regulatory and operational contexts, it must be comparable, consistent and traceable from its origin to storage. This requires applying clear classification criteria based on measurement quality, sensor type and operating conditions.
The European technical specification CEN/TS 17660 defines guidelines for the use of low-cost sensors in environmental monitoring, including requirements for validation, uncertainty and quality control. Following these criteria makes it possible to distinguish between indicative data and data suitable for regulatory compliance. This distinction is critical for audits, reporting to authorities and evidence-based decision-making.
The role of the Data Generating Process (DGP)
A numerical value is not only the result of what the sensor measures. It is the result of the entire process that generates it. From the location of the device, its calibration status, the local environmental conditions, the presence of interferences and the post-processing of the signal. This is known as the Data Generating Process (DGP).
Understanding the DGP allows correct interpretation of measurements and helps avoid misleading conclusions. For example, two sensors may report different values not because of a real concentration difference, but due to variations in their environment or calibration status.
Quality assurance and calibration in industrial environments
The real conditions in a refinery, temperature, humidity, interfering gases, vibrations, are very different from laboratory conditions. Sensors are affected by this. Without calibration strategies adapted to the environment, signal drift is inevitable and data quality degrades over time.
Calibration can be performed in the laboratory, in the field or through cross-referencing with higher-accuracy stations.
This must be combined with preventive maintenance routines, periodic validation and drift control. In practice, this is what turns a sensor network into a robust measurement system, capable of delivering consistent data over time and supporting both operations and regulatory compliance in complex industrial environments.
Specific applications in upstream, midstream and downstream
The oil and gas sector is not a uniform environment. Each segment of the value chain operates under different conditions, with different emission sources and dynamics, making it unworkable to apply a single monitoring model. Understanding these differences is not theoretical, it is the basis for designing more accurate measurement strategies that produce truly representative data at each location.
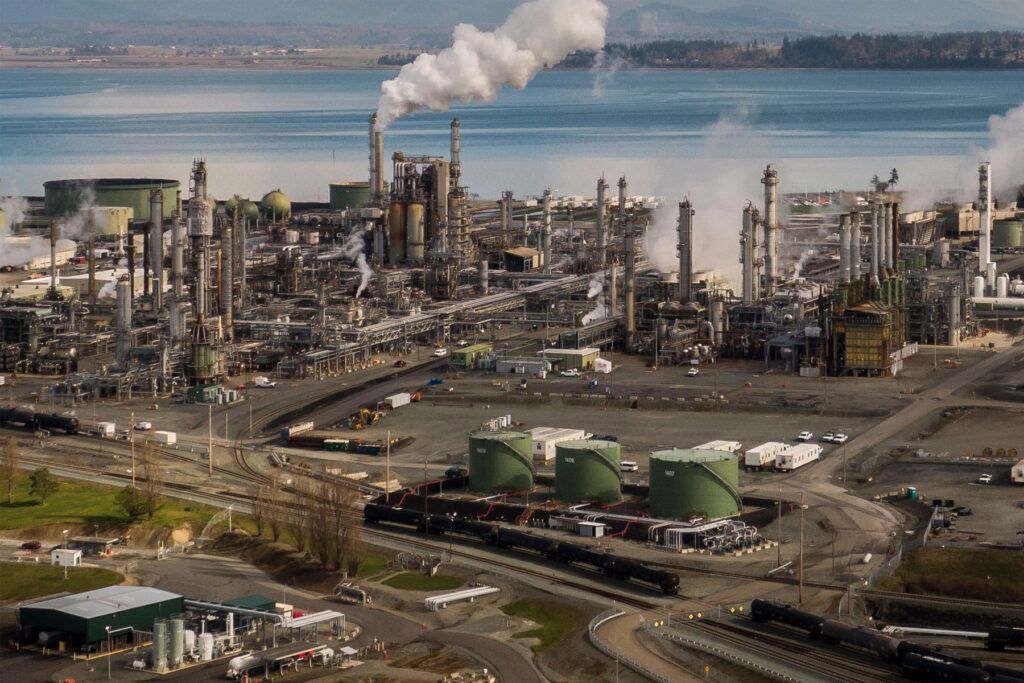
Refineries and process units
In the downstream segment, refineries concentrate complex thermal and chemical processes where emissions can originate both from channelled sources and diffuse leaks. This is where the highest density of emission sources per unit area is found.
Distillation, cracking or hydrotreatment units operate under high pressure and temperature, increasing the risk of emissions at critical points such as valves, flanges or sealing systems. Leaks are not occasional events, they are a statistical probability that increases with operating time.
These are combined with flare systems, which generate variable emissions linked to specific operating events. Especially emission peaks of NOx, SO2 and particles during events such as start-ups, shutdowns or load changes, which are difficult to anticipate and even harder to capture with periodic measurements.
This is where continuous monitoring allows correlating concentrations of VOC, NO2 or SO2 with specific events, turning environmental data into a tool for more precise process management.
Storage terminals and tanks
In storage facilities, emissions are closely linked to product volatility and to loading and unloading operations. It is inherent to the product. Tanks, especially floating roof tanks, can release VOC due to evaporation, temperature changes or vapour displacement. At the same time, logistics operations such as transfers between tanks or loading of trucks and vessels generate short-term emission peaks that are difficult to capture with spot inspections.
Continuous monitoring in these areas makes it possible to detect concentration increases linked to specific operations and assess the effectiveness of control systems such as seals or vapour recovery units.
Without continuous data, the effectiveness of these systems is, at best, an estimate.
Compression stations
In the midstream segment, compression stations are critical points for methane emissions. These systems keep gas flowing through pipelines using compressors that operate continuously.
Leaks can occur in seals, connections or auxiliary systems, and are often intermittent. The issue is not only a single leak. There is also a silent accumulation of small, sustained losses that, over time, can represent a significant volume of emissions.
Monitoring in these facilities makes it possible to identify deviations from expected system behaviour and prioritise maintenance actions before a minor leak escalates, especially in equipment with a higher probability of failure. This is the shift from reactive maintenance to evidence-based maintenance.
Petrochemical plants
Petrochemical plants add an extra layer of complexity by combining chemical transformation processes with the storage and handling of complex compounds. They do not only emit, they do so with variable composition. This means the simultaneous presence of multiple pollutants, from light hydrocarbons to more specific compounds depending on the process, as well as gases from secondary reactions.
Multi-parameter monitoring in these facilities makes it possible to capture this complexity and link emissions to specific operating conditions.
By generating useful information for both environmental control and process optimisation, environmental data and process data stop being separate domains.
Regulatory compliance and ESG pressure in the oil and gas sector
Measuring and controlling emissions in refineries is no longer only a technical or operational matter. It is a condition for viability. The regulatory framework has tightened, investors demand verifiable transparency and nearby communities have increasing influence over operations. In refineries, environmental data has moved from being a record to becoming a strategic asset.
European regulation (IED, ETS, Industrial Emissions Directive)
In Europe, the regulatory framework is mainly defined by the Industrial Emissions Directive (IED, 2010/75/EU), which sets strict requirements for pollution prevention and control in large industrial installations.
This directive requires the application of Best Available Techniques (BAT), ensuring that emissions remain within limits based on specific technical references (BAT conclusions). These are legally binding and require measurement systems that provide clear data on measurement methods, frequency and data quality that are representative and verifiable.
This is reinforced by the EU Emissions Trading System (EU ETS), which introduces an economic dimension to greenhouse gas control. Each tonne of CO2 emitted above allocated allowances has a cost. Accurate quantification of CO2 and other gases therefore has a direct impact on operational costs. Measuring accurately is more cost-effective than measuring poorly.
Continuous monitoring allows not only compliance with regulatory limits, but also better emissions management aligned with climate commitments.
EPA and US regulation
In the United States, the Environmental Protection Agency (EPA) regulates refinery emissions through a set of specific rules that combine emission limits, monitoring requirements and mandatory leak detection and repair programmes.
The EPA Refinery Rules include provisions for pollutants such as VOC, benzene and SO2, among others, together with defined methodologies for standardised measurement and inspection frequency. LDAR programmes are mandatory in most facilities and are subject to regular audits.
The EPA has also strengthened requirements for fenceline monitoring, such as those applied to benzene (Method 325), increasing the demand for continuous and comparable data.
This regulatory approach combines direct inspection with environmental measurement, increasing the technical demands on monitoring systems. It is not enough to stay below limits, it must be demonstrated with traceable data.
Environmental reporting and audit requirements
Compliance is not enough if it cannot be demonstrated. Facilities must record, store and present environmental data under strict criteria of quality, consistency and traceability. Any inconsistency in historical data, such as undocumented calibration or missing data periods, can compromise audits or trigger additional requirements from authorities.
Regulatory pressure is reinforced by sustainability reporting frameworks. The IFRS Sustainability (ISSB) standards include environmental indicators that require verifiable and comparable data over time, in line with the Corporate Sustainability Reporting Directive (CSRD) in Europe. For finance and sustainability teams, this means that emissions data generated on site must be integrated into reports verified by third parties. In this context, digitalisation and real-time integration are reporting requirements, not optional improvements.
Data transparency and social licence to operate
Beyond regulation and investors, refineries face increasing social pressure from nearby communities to demonstrate responsible environmental management. The availability of objective and accessible data shows the company’s ability to demonstrate how it manages its environmental impact.
Continuous monitoring provides objective information on air quality around the facility.
Proactively communicating emissions data and responding with evidence during incidents is a best practice in stakeholder relations and a key element in managing reputational risk.
Facilities that lead in environmental transparency reduce conflicts, accelerate permitting processes and strengthen their position in future regulatory reviews. Emissions control is no longer an isolated requirement, it is now part of the core business strategy.
Operational benefits of continuous emissions control
Regulatory compliance is the starting point, not the end goal. Continuous monitoring responds to regulatory requirements, but also introduces direct improvements in daily refinery operations. Turning emissions into a measurable and analysable variable makes it possible to act with greater precision, reduce uncertainty and optimise resources. Refineries that have integrated continuous monitoring as an operational tool uncover something beyond compliance, emissions data reveals insights that no other system provides.
Reduction of product losses
A leak of CH4 or VOC is not only an environmental issue. It is product escaping through a joint, seal or worn valve. It is, ultimately, product that does not reach the process and does not generate value. The longer that leak remains undetected, the greater the accumulated loss.
Continuous monitoring drastically reduces this interval. Instead of waiting for the next inspection cycle, it identifies deviations in real time and enables action before losses become significant.
The result is a lower environmental impact and a more efficient economic balance. In this case, both objectives align in the same direction.
Reduced risk of penalties
An isolated exceedance can be managed. Ongoing exceedances of emission limits or a lack of traceable data can lead to penalties, operational restrictions or regulatory reviews. Exposure to this risk depends not only on what happens in the plant, but on the ability to demonstrate it.
Continuous monitoring makes it possible to detect threshold exceedances as they occur and activate corrective actions before they become sustained non-compliance.
When audits or inspections take place, having complete, consistent and traceable historical data provides documentary strength. It is the difference between a smooth resolution and additional requirements.
Optimisation of LDAR programmes
With continuous monitoring, LDAR programmes remain essential, but they become more effective. Their performance improves when supported by continuous data that identifies areas or equipment with a higher probability of leaks. Inspections can then be prioritised where they are truly needed, instead of following a uniform approach. This reduces inspection time and improves the detection rate of relevant leaks.
In addition, recurrence analysis, identifying equipment that repeatedly generates emissions, turns historical data into a maintenance decision tool, not just a record.
Improved operational efficiency based on data
Emissions do not occur in isolation. They appear when process load changes, when combustion conditions shift or when a start-up does not evolve as expected. Linking environmental data to the operational variable that causes it is what turns continuous monitoring into a process management tool, not just an environmental one.
Identifying these patterns allows adjusting parameters, anticipating risk situations and avoiding emissions that are not inevitable, but the result of correctable operating conditions. Environmental data stops being a passive indicator reviewed after the fact and becomes an active signal that informs decisions in real time. This is where continuous monitoring delivers its full operational value.
How to reduce gas and particle emissions in refineries
Reducing emissions in a refinery is not a discretionary decision. It is based on a technical and regulatory obligation built around Best Available Techniques (BAT). European reference documents that define essential technical criteria to minimise the environmental impact of large industrial installations.
Their application is not occasional. BAT applies at different stages of the operational cycle: during the application for an Integrated Environmental Authorisation (IEA) for new units, in modernisation processes of existing facilities and in periodic IEA reviews, which are updated after the publication of new BAT conclusions.
BAT acts on multiple factors influencing emissions. These include the selection of low-sulphur fuels, improving the efficiency of furnaces and boilers or implementing reduction systems such as filters and catalysts.
However, none of these measures can be verified without measurement. Continuous monitoring is the element that closes the loop. Measuring gases and particles in real time makes it possible to verify the effectiveness of implemented measures, detect deviations and adjust operations to keep emissions under control. Without continuous data, emission reduction is an intention. With it, it becomes a manageable variable.

Kunak AIR environmental monitoring stations provide a complete solution for monitoring in oil and gas facilities.
Kunak solution for emissions monitoring in refineries
Kunak solutions do not replace traditional emission control systems, they integrate with them and enhance them. They add a continuous and distributed view of air quality that conventional methods cannot provide in complex industrial environments such as refineries.
Kunak sensor networks combine continuous measurements through permanently installed devices with the analysis of secondary parameters that help interpret emission behaviour under different operating conditions. The result is a dynamic view of the facility, not a snapshot, but a continuous understanding of how pollutants evolve depending on operations, meteorology and environmental conditions.
A practical example is the creation of virtual perimeters that allow monitoring the evolution of fugitive emissions around the facility. This approach enables the detection of abnormal increases, even when the emission source is not visible or is distributed across multiple points.
In this way, monitoring stops being a requirement to manage and becomes an operational tool that actively works, enabling anticipation of issues, strengthening environmental control and improving data-driven decision-making.
Frequently asked questions about emissions monitoring in refineries
Which pollutants should be monitored in a refinery?
The selection of pollutants depends on the type of process and regulatory requirements, but there are common priority compounds in most refining facilities. These include methane (CH4)Methane, known chemically as CH4, is a gas that is harmful to the atmosphere and to living beings because it has a high heat-trapping capacity. For this ...
Read more, volatile organic compounds (VOC), benzene, nitrogen oxides (NOx), sulphur dioxide (SO2)Sulphur dioxide (SO2) is a colourless gas with a pungent odour that causes an irritating sensation similar to shortness of breath. Its origin is anthropoge...
Read more and particles (PM10, PM2.5). Depending on the specific activity, other gases such as H2S, CO or ammonia may also be included.
There is no universal configuration. The key is to adapt monitoring to the specific risks of each facility and ensure multi-parameter coverage that captures the diversity of emissions present on site.
What is the difference between LDAR and continuous monitoring?
LDAR programmes rely on periodic inspections to detect and repair leaks in specific equipment. They identify the problem, but only when actively searched for. This approach allows locating emission points, but does not capture temporal variability. Intermittent emissions occurring between inspection cycles simply remain undetected in an LDAR-only system.
Continuous monitoring, on the other hand, measures concentrations in real time without interruption. This allows detecting intermittent emissions, identifying patterns and understanding context to act more effectively and quickly.
Both approaches are not competing, they are complementary. Continuous monitoring provides context and prioritisation, while LDAR enables direct intervention. Together they form a much more complete emissions control system with fewer blind spots.
What is fenceline monitoring and when is it mandatory?
Fenceline monitoring consists of measuring pollutants at the facility perimeter to assess their real impact on the surrounding environment. This approach detects emissions leaving the site, regardless of their exact origin. It is an impact-based perspective, not a source-based one.
In some countries, such as the United States, it is mandatory for certain pollutants. For example, EPA regulations require perimeter monitoring of benzene in specific refineries.
In Europe, it is not always mandatory, but it is increasingly used as a tool to strengthen environmental control and demonstrate compliance.
Mandatory or not, more and more refineries are adopting it for a practical reason: it is the only technical approach that measures what actually reaches the outside environment.
How does methane monitoring help reduce fugitive emissions?
Methane (CH4) is a direct indicator that something is leaking. Its presence at abnormal concentrations does not require prior inspection to be evident. A real-time increase already signals that there is an active leak somewhere in the system.
By detecting these anomalies in real time, it is possible to reduce response time and limit the duration of leaks. Less active time means lower climate impact, less product loss and more targeted maintenance actions.
Beyond immediate detection, historical analysis provides additional value. It reveals which equipment fails repeatedly, under what operating conditions peaks occur and where to focus the next intervention. Leaks stop being unexpected events and become predictable variables.
Can a sensor network replace reference stations?
Sensor networks do not replace reference stations, but they complement them. Reference stations provide high accuracy and are used for strict regulatory compliance. However, they have a structural limitation, they are fixed points in an environment where emissions move, vary and are spatially distributed.
Sensor networks provide what a single station cannot: spatial coverage and temporal resolution. More measurement points, more continuous data and a more complete picture of how emissions evolve inside and outside the facility. They may not reach the absolute precision of reference instruments, but they offer a level of representativeness that a single point cannot achieve.
The key lies in design and calibration. Networks built following standards such as CEN/TS 17660 generate reliable data, classified by uncertainty level and suitable for supporting both operational and regulatory decisions.
Conclusion: turning emissions into a controllable variable
Refineries that manage emissions effectively are not those with fewer leaks by chance. They are those that have chosen to measure continuously, rigorously and with the right technical architecture so that data becomes useful beyond simple reporting.
The real shift is not technological, it is conceptual. It is a transition from estimating to measuring, from periodic inspection to real-time monitoring, from reacting to non-compliance to anticipating it.
This shift makes it possible to understand what is happening at any moment and act before the impact becomes significant. It is the difference between reactive management and active emissions control.
Continuous monitoring delivers benefits across multiple dimensions. From an operational perspective, it turns emissions detection into a strategic tool that identifies leaks before they accumulate impact. By detecting deviations in real time, it enables early correction, reducing both environmental risk and exposure to penalties.
In addition, integrating this data into environmental management systems facilitates its use in audits, reporting and evidence-based operational decision-making. Information is no longer isolated, it becomes part of a coherent system aligned with regulatory requirements and ESG commitments.
Scientific references
- Environmental Protection Agency (EPA). (2023). Refinery sector rule risk and technology review.
- Intergovernmental Panel on Climate Change (IPCC). (2022). Climate change 2022: Mitigation of climate change. Contribution of working group III to the sixth assessment report.
- International Energy Agency (IEA). (2023). Global methane tracker 2023.
- Snyder, E. G., et al. (2013). The changing paradigm of air pollution monitoring. Environmental Science & Technology, 47(20), 11369 to 11377.
- Dong, J., et al. (2025). Calibration and validation-based assessment of low-cost air quality sensorMeasuring air quality is essential for improving human and environmental health. Changes in the natural composition of the air we breathe are common in ind...
Read mores. Science of the Total Environment, 977, 179364. - World Health Organization (WHO). (2021). WHO global air quality guidelines.
- European Commission. (2010). Industrial emissions directive (2010/75/EU).